课程 12 - 绘制折线
让我们继续添加基础图形:折线。在这节课中你将学习到以下内容:
- 为什么不直接使用
gl.LINES? - 在 CPU 或者 Shader 中构建 Mesh
- 分析 Shader 细节,包括:
- 拉伸顶点与接头
- 反走样
- 绘制虚线
- 如何计算折线的包围盒?
$icCanvas = call(() => {
    return document.createElement('ic-canvas-lesson12');
});call(() => {
const { Canvas, Polyline, Rect } = Lesson12;
const stats = new Stats();
stats.showPanel(0);
const $stats = stats.dom;
$stats.style.position = 'absolute';
$stats.style.left = '0px';
$stats.style.top = '0px';
$icCanvas.parentElement.style.position = 'relative';
$icCanvas.parentElement.appendChild($stats);
$icCanvas.addEventListener('ic-ready', (e) => {
const canvas = e.detail;
const polyline1 = new Polyline({
points: [
[100, 100],
[100, 200],
[200, 100],
],
stroke: 'red',
strokeWidth: 20,
fill: 'none',
});
canvas.appendChild(polyline1);
const polyline2 = new Polyline({
points: [
[220, 100],
[220, 200],
[320, 100],
],
stroke: 'red',
strokeWidth: 20,
strokeLinejoin: 'bevel',
fill: 'none',
});
canvas.appendChild(polyline2);
const polyline3 = new Polyline({
points: [
[340, 100],
[340, 200],
[440, 100],
],
stroke: 'red',
strokeWidth: 20,
strokeLinejoin: 'round',
strokeLinecap: 'round',
fill: 'none',
});
canvas.appendChild(polyline3);
const polyline4 = new Polyline({
points: [
[100, 300],
[200, 300],
[300, 210],
[400, 300],
[500, 300],
],
stroke: 'red',
strokeWidth: 20,
strokeLinejoin: 'round',
strokeLinecap: 'round',
strokeDasharray: [10, 5],
fill: 'none',
});
canvas.appendChild(polyline4);
const rect2 = new Rect({
x: 500,
y: 100,
fill: 'black',
fillOpacity: 0.5,
stroke: 'red',
strokeWidth: 10,
dropShadowBlurRadius: 10,
dropShadowColor: 'black',
dropShadowOffsetX: 10,
dropShadowOffsetY: 10,
strokeDasharray: [5, 5],
});
rect2.width = 100;
rect2.height = 100;
canvas.appendChild(rect2);
});
$icCanvas.addEventListener('ic-frame', (e) => {
stats.update();
});
});gl.LINES 的局限性
WebGL 原生提供的 gl.LINES 和 gl.LINE_STRIP 在实际场景中往往并不好用:
- 不支持宽度。如果我们尝试使用 lineWidth,常见浏览器例如 Chrome 会抛出警告:
WARNING
As of January 2017 most implementations of WebGL only support a minimum of 1 and a maximum of 1 as the technology they are based on has these same limits.
需要注意的是,在 课程 5 - 直线网格 中的方案并不适合绘制任意线段,它甚至无法任意定义线段的两个端点。另外线段和折线的最大区别在于对于接头处的处理,deck.gl 就分别提供了 LineLayer 和 PathLayer。
现在让我们明确一下希望实现的折线相关特性:
- 支持任意线宽
- 支持定义任意数量的端点。类似 SVG 的 points 属性。
- 支持相邻线段间的连接形状 stroke-linejoin 和端点形状 stroke-linecap
- 支持虚线。stroke-dashoffset 和 stroke-dasharray
- 良好的反走样效果
- 支持 instanced 绘制,详见之前介绍过的 instanced drawing
我们设计的 API 如下:
const line = new Polyline({
  points: [
    [0, 0],
    [100, 100]
  ],
  strokeWidth: 100,
  strokeLinejoin: 'round'
  strokeLinecap: 'round',
  strokeMiterlimit: 4,
  strokeDasharray: [4, 1],
  strokeDashoffset: 10
});
先来看第一个问题:如何实现任意数值的 strokeWidth。
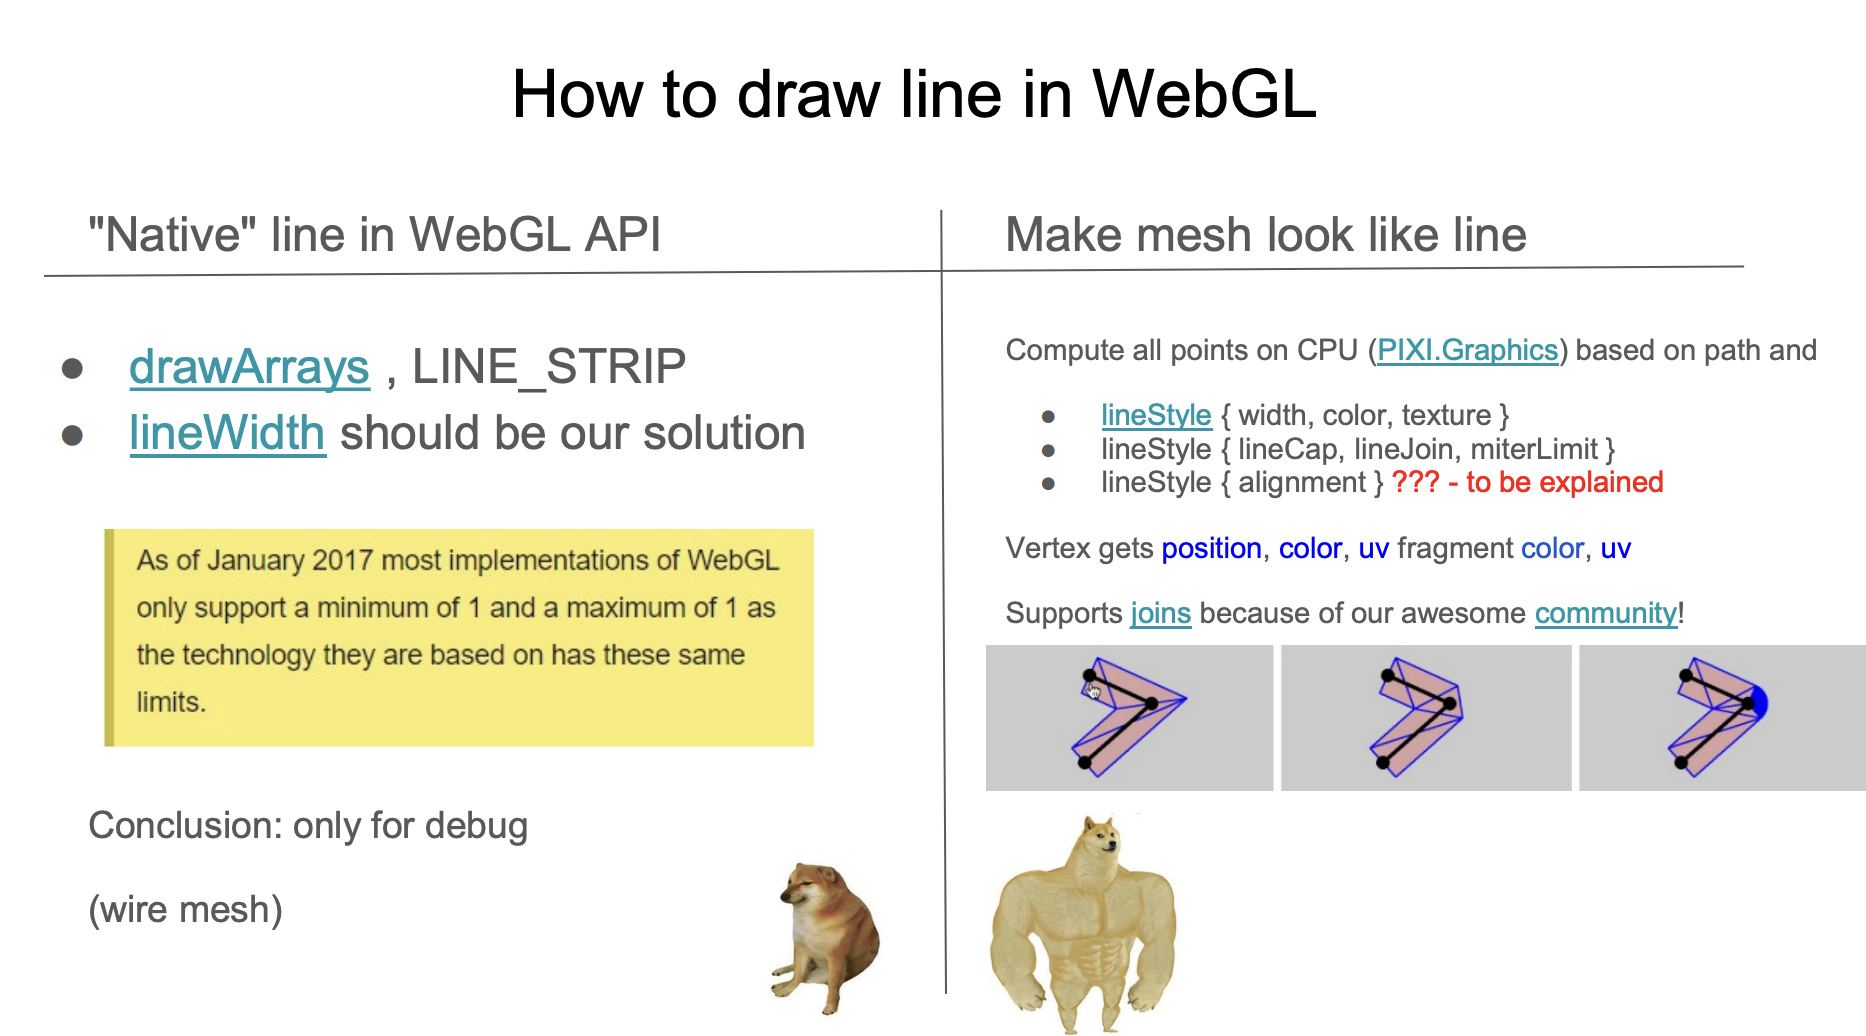
构建 Mesh
下图来自 Pixi.js 在 WebGL meetup 上的分享:How 2 draw lines in WebGL,本文会大量引用其中的截图,我会把 PPT 中的页数标注上。既然原生方法不可用,还是只能回到构建 Mesh 的传统绘制方案。
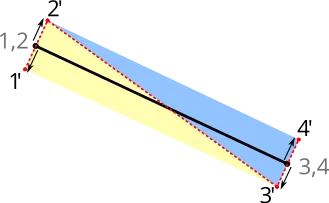
常用的做法是沿线段法线方向进行拉伸后三角化。下图来自 Drawing Antialiased Lines with OpenGL,线段两个端点分别沿红色虚线法向向两侧拉伸,形成 4 个顶点,三角化成 2 个三角形,这样 strokeWidth 就可以是任意值了。
在 CPU 中构建
线段的拉伸以及 strokeLinejoin 和 strokeLinecap 的 Mesh 构建可以在 CPU 或 Shader 中完成。按照前者思路的实现包括:

可以看出在 strokeLinejoin 和 strokeLinecap 取值为 round 的情况下,为了让圆角看起来平滑,构建 Mesh 需要最多的顶点数。在 regl-gpu-lines 中,每一段至多需要 32 * 4 + 6 = 134 个顶点:
// @see https://github.com/rreusser/regl-gpu-lines/blob/main/src/index.js#L81
cache.indexBuffer = regl.buffer(
new Uint8Array([...Array(MAX_ROUND_JOIN_RESOLUTION * 4 + 6).keys()]), // MAX_ROUND_JOIN_RESOLUTION = 32
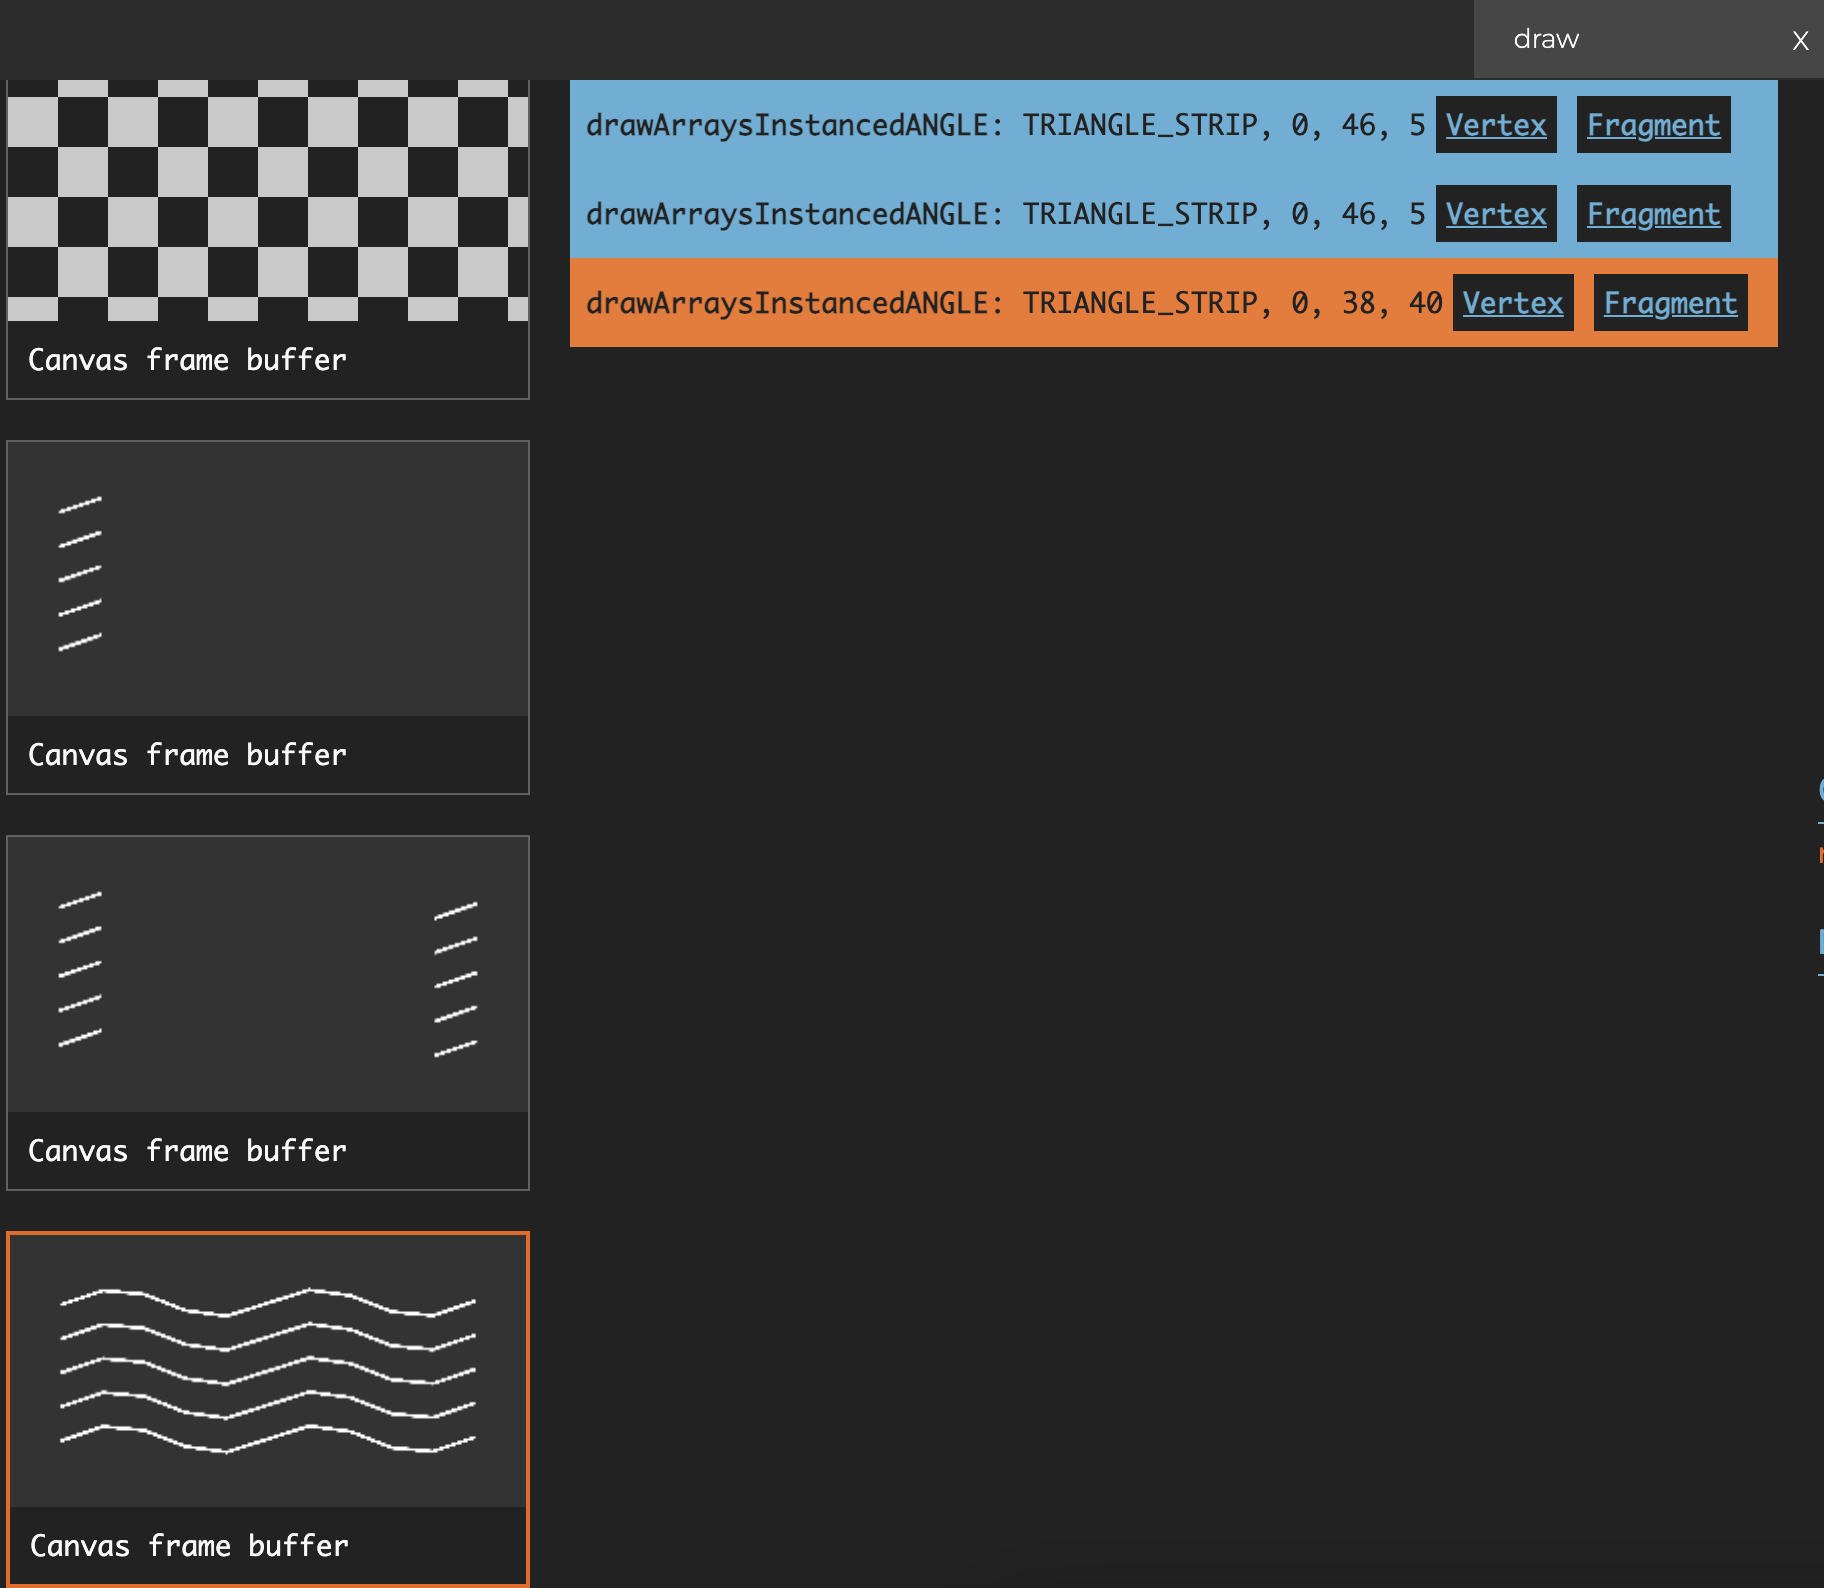
);strokeLinecap 和线段需要分成不同 Drawcall 绘制,还是以 regl-gpu-lines 的 instanced example 为例,需要编译两个 Program 并使用 3 个 Drawcall 绘制,其中:
- 两个端点使用同一个 Program,只是 Uniform
orientation不同。顶点数目为cap + join - 所有中间的线段使用使用一个 Drawcall 绘制,顶点数目为
join + join,instance 数目为线段数目
const computeCount = isEndpoints
    ? // Draw a cap
      (props) => [props.capRes2, props.joinRes2]
    : // Draw two joins
      (props) => [props.joinRes2, props.joinRes2];
如果存在多条折线,可以进行合并的条件是 strokeLinecap 和 strokeLinejoin 的取值以及线段数量相同。下图展示了绘制了 5 条折线的情况,其中每一条折线的中间线段部分包含 8 个 instance,因此 instance 总数为 40:
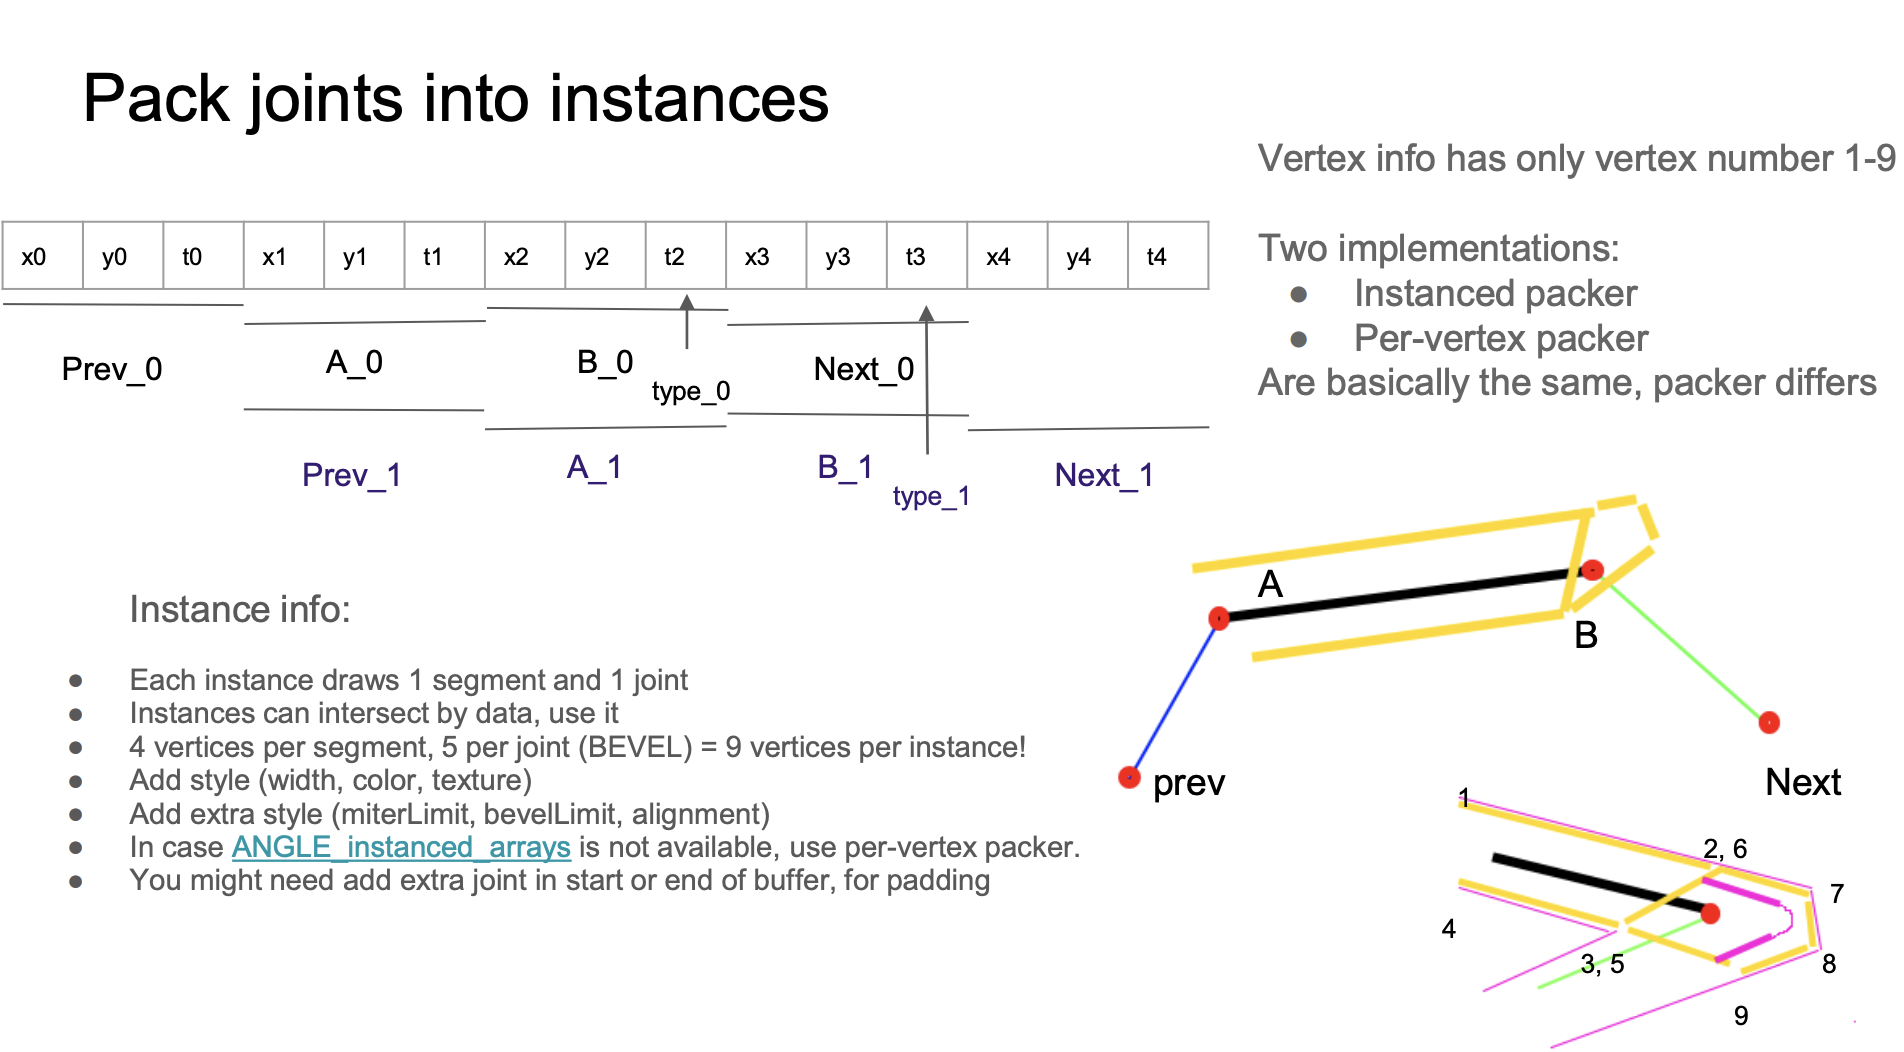
在 Shader 中构建
来自 Pixi.js 在 WebGL meetup 上的分享,在 Shader 中构建 Mesh:
相比在 CPU 中构建,它的优点包括:
- 只需要一个 Drawcall 绘制
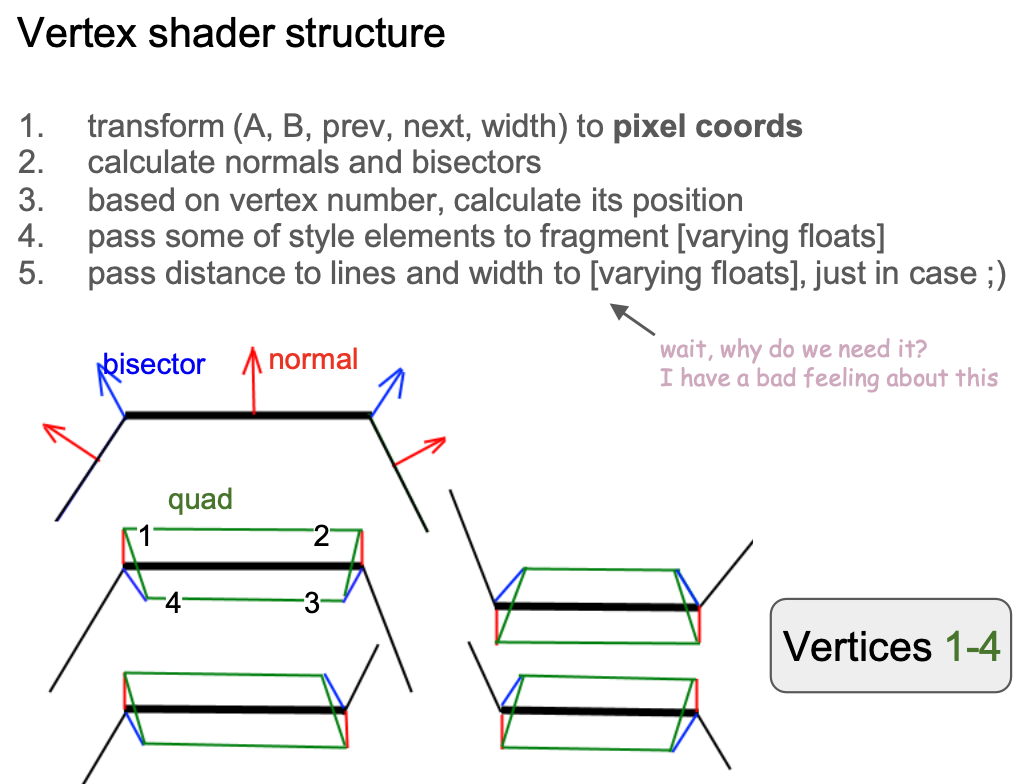
strokeLinecapstrokeLineJoin和中间线段 - 顶点固定为 9 个,其中 1234 号顶点组成的两个三角形用来绘制线段部分,56789 号顶点组成的三个三角形用来绘制接头部分
- 当
strokeLinecapstrokeLinejoin取值为round时更平滑,原因是在 Fragment Shader 中使用了类似 SDF 绘制圆的方法 - 良好的反走样效果
layout(location = ${Location.PREV}) in vec2 a_Prev;
layout(location = ${Location.POINTA}) in vec2 a_PointA;
layout(location = ${Location.POINTB}) in vec2 a_PointB;
layout(location = ${Location.NEXT}) in vec2 a_Next;
layout(location = ${Location.VERTEX_JOINT}) in float a_VertexJoint;
layout(location = ${Location.VERTEX_NUM}) in float a_VertexNum;
Buffer 排布格式如下,每个 Stride 大小为 4 * 3。Buffer 中同一块连续数据例如 x1 y1 t1 在第一个 instance 中被读取为 A_0,在第二个 instance 中被读取为 Prev_1,这种 intersect 的排布方式可以最大限度节约 Buffer 大小:
const vertexBufferDescriptors: InputLayoutBufferDescriptor[] = [
    {
        arrayStride: 4 * 3,
        stepMode: VertexStepMode.INSTANCE,
        attributes: [
            {
                format: Format.F32_RG,
                offset: 4 * 0,
                shaderLocation: Location.PREV,
            },
            {
                format: Format.F32_RG,
                offset: 4 * 3,
                shaderLocation: Location.POINTA,
            },
            {
                format: Format.F32_R,
                offset: 4 * 5,
                shaderLocation: Location.VERTEX_JOINT,
            },
            {
                format: Format.F32_RG,
                offset: 4 * 6,
                shaderLocation: Location.POINTB,
            },
            {
                format: Format.F32_RG,
                offset: 4 * 9,
                shaderLocation: Location.NEXT,
            },
        ],
    },
];
但很不幸,如果我们切换到 WebGPU 渲染器下会得到如下报错:
WARNING
Attribute offset (12) with format VertexFormat::Float32x2 (size: 8) doesn't fit in the vertex buffer stride (12).
原因是是 WebGPU 针对 VertexBufferLayout 存在如下校验规则,而我们的 arrayStride 为 4 * 3。WebGPU instancing problem 和 spec: It is useful to allow GPUVertexBufferLayout.arrayStride to be less than offset + sizeof(attrib.format) 也提及了这一点。
attrib.offset + byteSize(attrib.format) ≤ descriptor.arrayStride.
4 * 3 + 4 * 2 ≤ 4 * 3 // Oops!
因此我们不得不重新改变 Buffer 的排布方式。首先在 Layout 中从一个 Buffer 包含多个 Attribute 的排布拆分成多个 Buffer,每个 Buffer 中仅包含一个 Attribute:
const vertexBufferDescriptors: InputLayoutBufferDescriptor[] = [
    {
        arrayStride: 4 * 3,
        stepMode: VertexStepMode.INSTANCE,
        attributes: [
            {
                format: Format.F32_RG,
                offset: 4 * 0,
                shaderLocation: Location.PREV,
            },
        ],
    },
    {
        arrayStride: 4 * 3,
        stepMode: VertexStepMode.INSTANCE,
        attributes: [
            {
                format: Format.F32_RG,
                offset: 4 * 0,
                shaderLocation: Location.POINTA,
            },
        ],
    },
    // 省略 VERTEX_JOINT
    // 省略 POINTB
    // 省略 NEXT
];
虽然拆分成了多个 BufferLayout 声明,但实际引用的还是同一份 Buffer,只是通过 offset 读取到对应的 Attribute,详见:Offset in bytes into buffer where the vertex data begins。
const buffers = [
{
buffer: this.#segmentsBuffer, // PREV
},
{
buffer: this.#segmentsBuffer, // POINTA
offset: 4 * 3,
},
{
buffer: this.#segmentsBuffer, // VERTEX_JOINT
offset: 4 * 5,
},
{
buffer: this.#segmentsBuffer, // POINTB
offset: 4 * 6,
},
{
buffer: this.#segmentsBuffer, // NEXT
offset: 4 * 9,
},
];
renderPass.setVertexInput(this.#inputLayout, buffers, {
buffer: this.#indexBuffer,
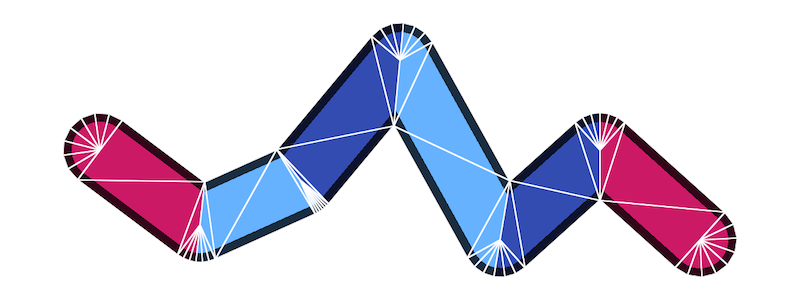
});至此我们就完成了 Mesh 的构建,后续其他特性也会基于这种方案实现。在下面的例子中我们展示了 Wireframe:
Shader 实现分析
首先来看如何在线段主体与接头处对顶点进行拉伸。
线段主体拉伸
我们先关注 1 ~ 4 号顶点,即线段的主体部分。考虑该线段与前、后相邻线段呈现的夹角,有以下四种形态 /-\ \-/ /-/ 和 \-\:
在计算单位法线向量前,先将各个顶点的位置转换到模型坐标系下:
vec2 pointA = (model * vec3(a_PointA, 1.0)).xy;
vec2 pointB = (model * vec3(a_PointB, 1.0)).xy;

vec2 xBasis = pointB - pointA;
float len = length(xBasis);
vec2 forward = xBasis / len;
vec2 norm = vec2(forward.y, -forward.x);

xBasis2 = next - base;
float len2 = length(xBasis2);
vec2 norm2 = vec2(xBasis2.y, -xBasis2.x) / len2;
float D = norm.x * norm2.y - norm.y * norm2.x;
以第一种形态为例,1、2 号顶点沿法线向外拉伸,3、4 号顶点沿接头处的角平分线(doBisect())向内拉伸:
if (vertexNum < 3.5) { // Vertex #1 ~ 4
    if (abs(D) < 0.01) {
        pos = dy * norm;
    } else {
        if (flag < 0.5 && inner < 0.5) { // Vertex #1, 2
            pos = dy * norm;
        } else { // Vertex #3, 4
            pos = doBisect(norm, len, norm2, len2, dy, inner);
        }
    }
}
接头拉伸
接下来关注接头处的 5 ~ 9 号顶点,依据接头形态不同拉伸方向和距离都有变化,原作者实现非常复杂,其中 bevel 和 round 共用一种拉伸方式,后者在 Fragment Shader 中再通过 SDF 完成圆角的绘制。
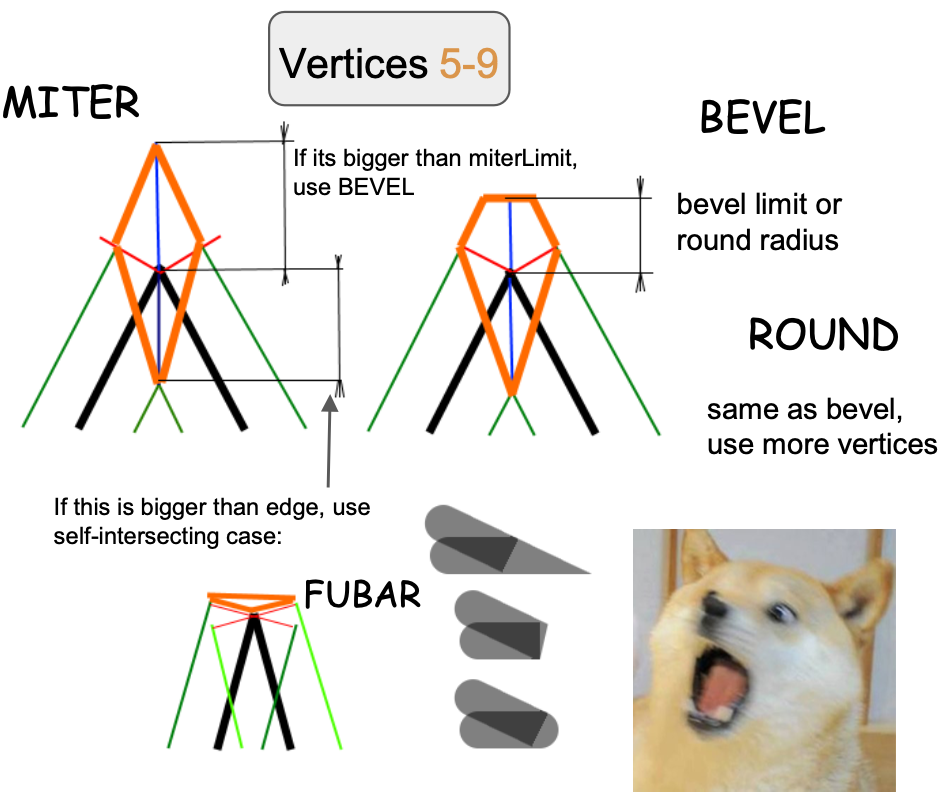
我们就以最简单的 miter 展开分析,根据定义,如果超过 strokeMiterlimit 就转换成 bevel。
if (length(pos) > abs(dy) * strokeMiterlimit) {
    type = BEVEL;
} else {
    if (vertexNum < 4.5) {
        dy = -dy;
        pos = doBisect(norm, len, norm2, len2, dy, 1.0);
    } else if (vertexNum < 5.5) {
        pos = dy * norm;
    } else if (vertexNum > 6.5) {
        pos = dy * norm2;
    }
    v_Type = 1.0;
    dy = -sign * dot(pos, norm);
    dy2 = -sign * dot(pos, norm2);
    hit = 1.0;
}
值得一提的是,在 Cairo 中采用 round 还是 bevel 接头需要根据 arc height 判断,下图来自:Cairo - Fix for round joins

反走样
最后我们来看如何对线段边缘进行反走样。之前我们介绍过 SDF 中的反走样,这里使用类似思路:
- 在 Vertex Shader 中计算顶点到线段的垂直单位向量,通过
varying传递给 Fragment Shader 完成自动插值 - 插值后的向量不再是单位向量了,计算它的长度就是当前像素点到线段的垂直距离,在
[0, 1]范围内 - 利用这个值计算像素点最终的透明度,完成反走样。
smoothstep发生在线段边缘,即[linewidth - feather, linewidth + feather]的区间内。下图来自:Drawing Antialiased Lines with OpenGL,具体计算逻辑稍后会详细介绍。
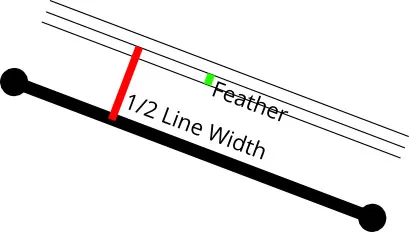
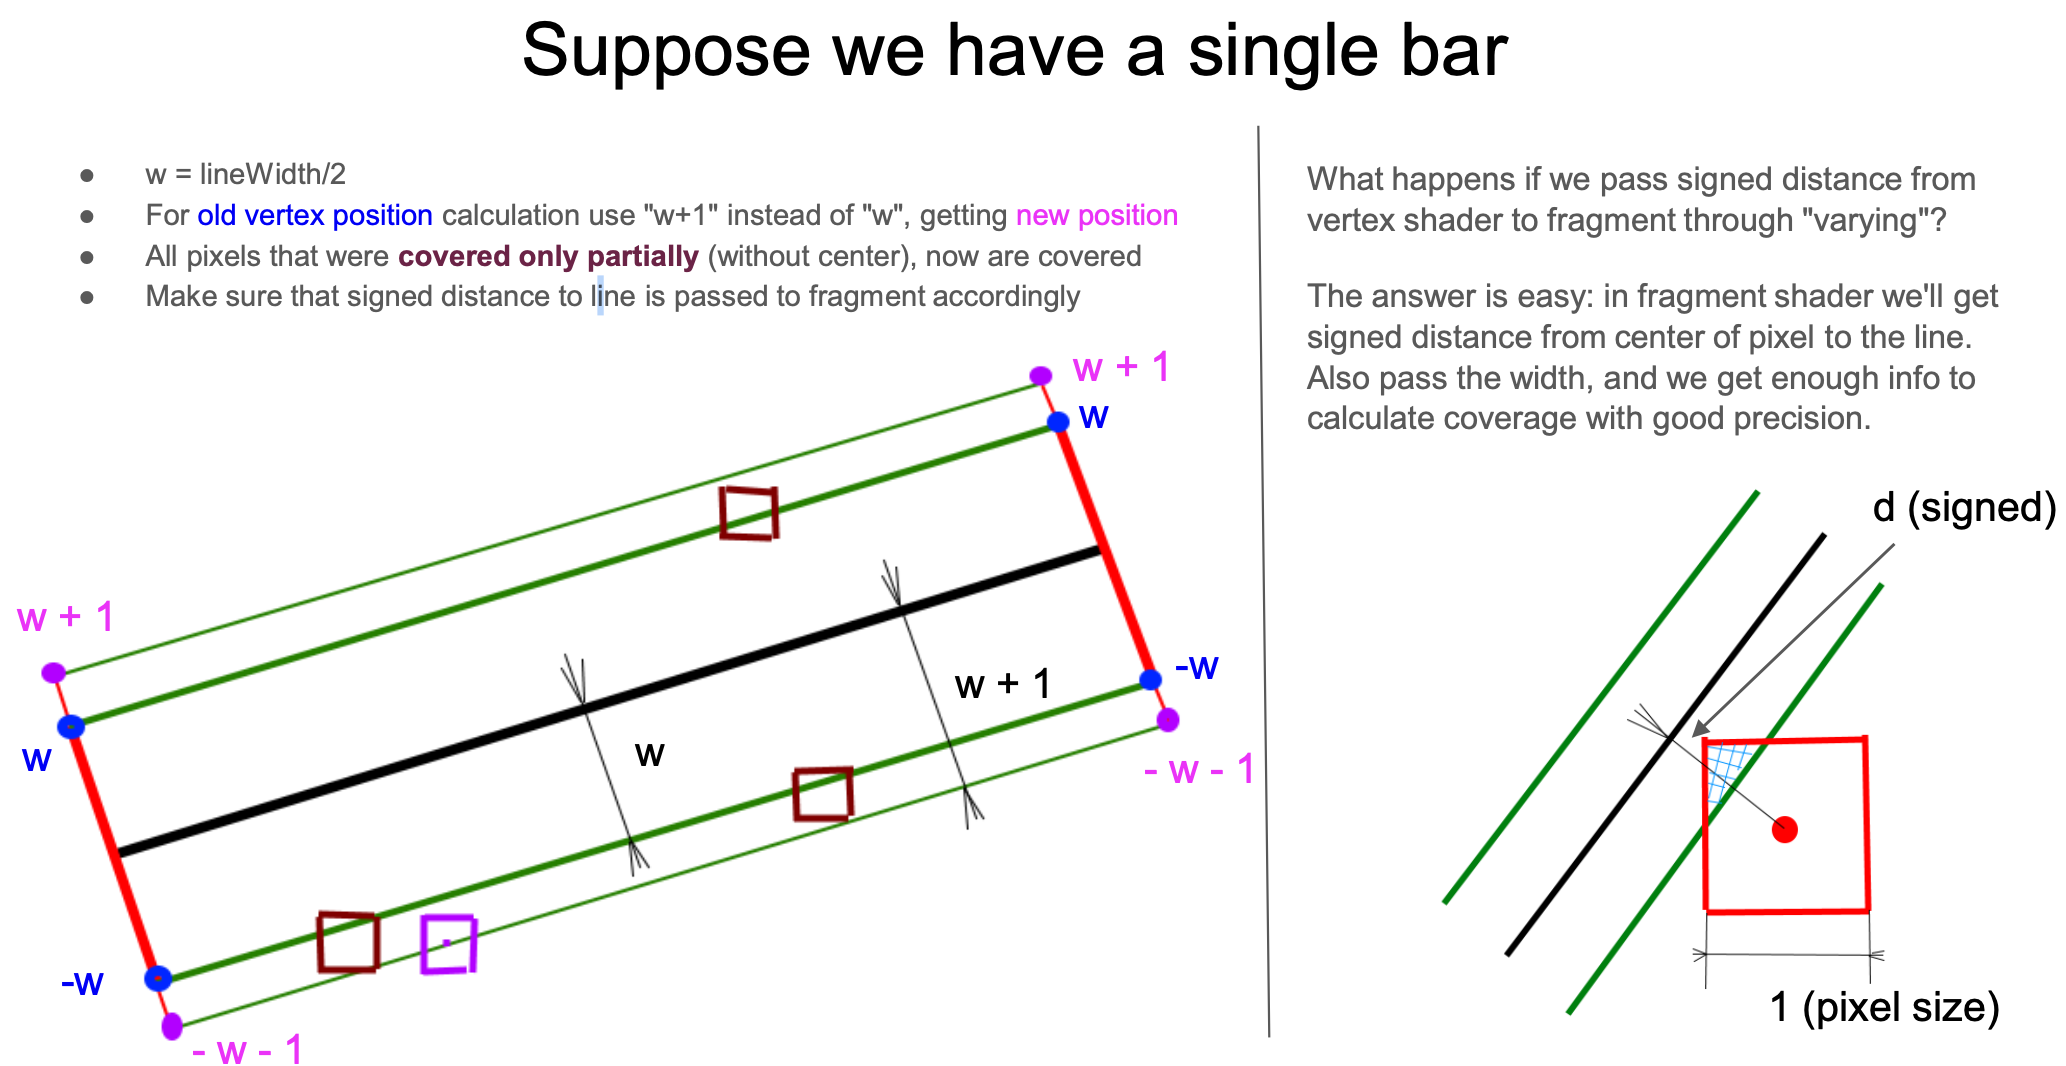
这个 "feather" 取多少合适呢?在之前的 绘制矩形外阴影 中,我们在矩形原有尺寸上外扩了 3 * dropShadowBlurRadius。下图依然来自 How 2 draw lines in WebGL,向外扩展一个像素(从 w -> w+1)即可。在另一侧的两个顶点(#3 和 #4 号顶点)距离为负:
const float expand = 1.0;
lineWidth *= 0.5;

float dy = lineWidth + expand; // w + 1
if (vertexNum >= 1.5) { // Vertex #3 & #4
  dy = -dy; // -w - 1
}
从下右图还可以看出,当我们放大来看 Fragment Shader 中的每一个像素,利用这个有向距离 d 就可以计算出线段和当前像素的覆盖度(下图三角形的面积),实现反走样效果。
那么如何利用这个距离计算覆盖度呢?这里需要分成线段主体和接头情况。
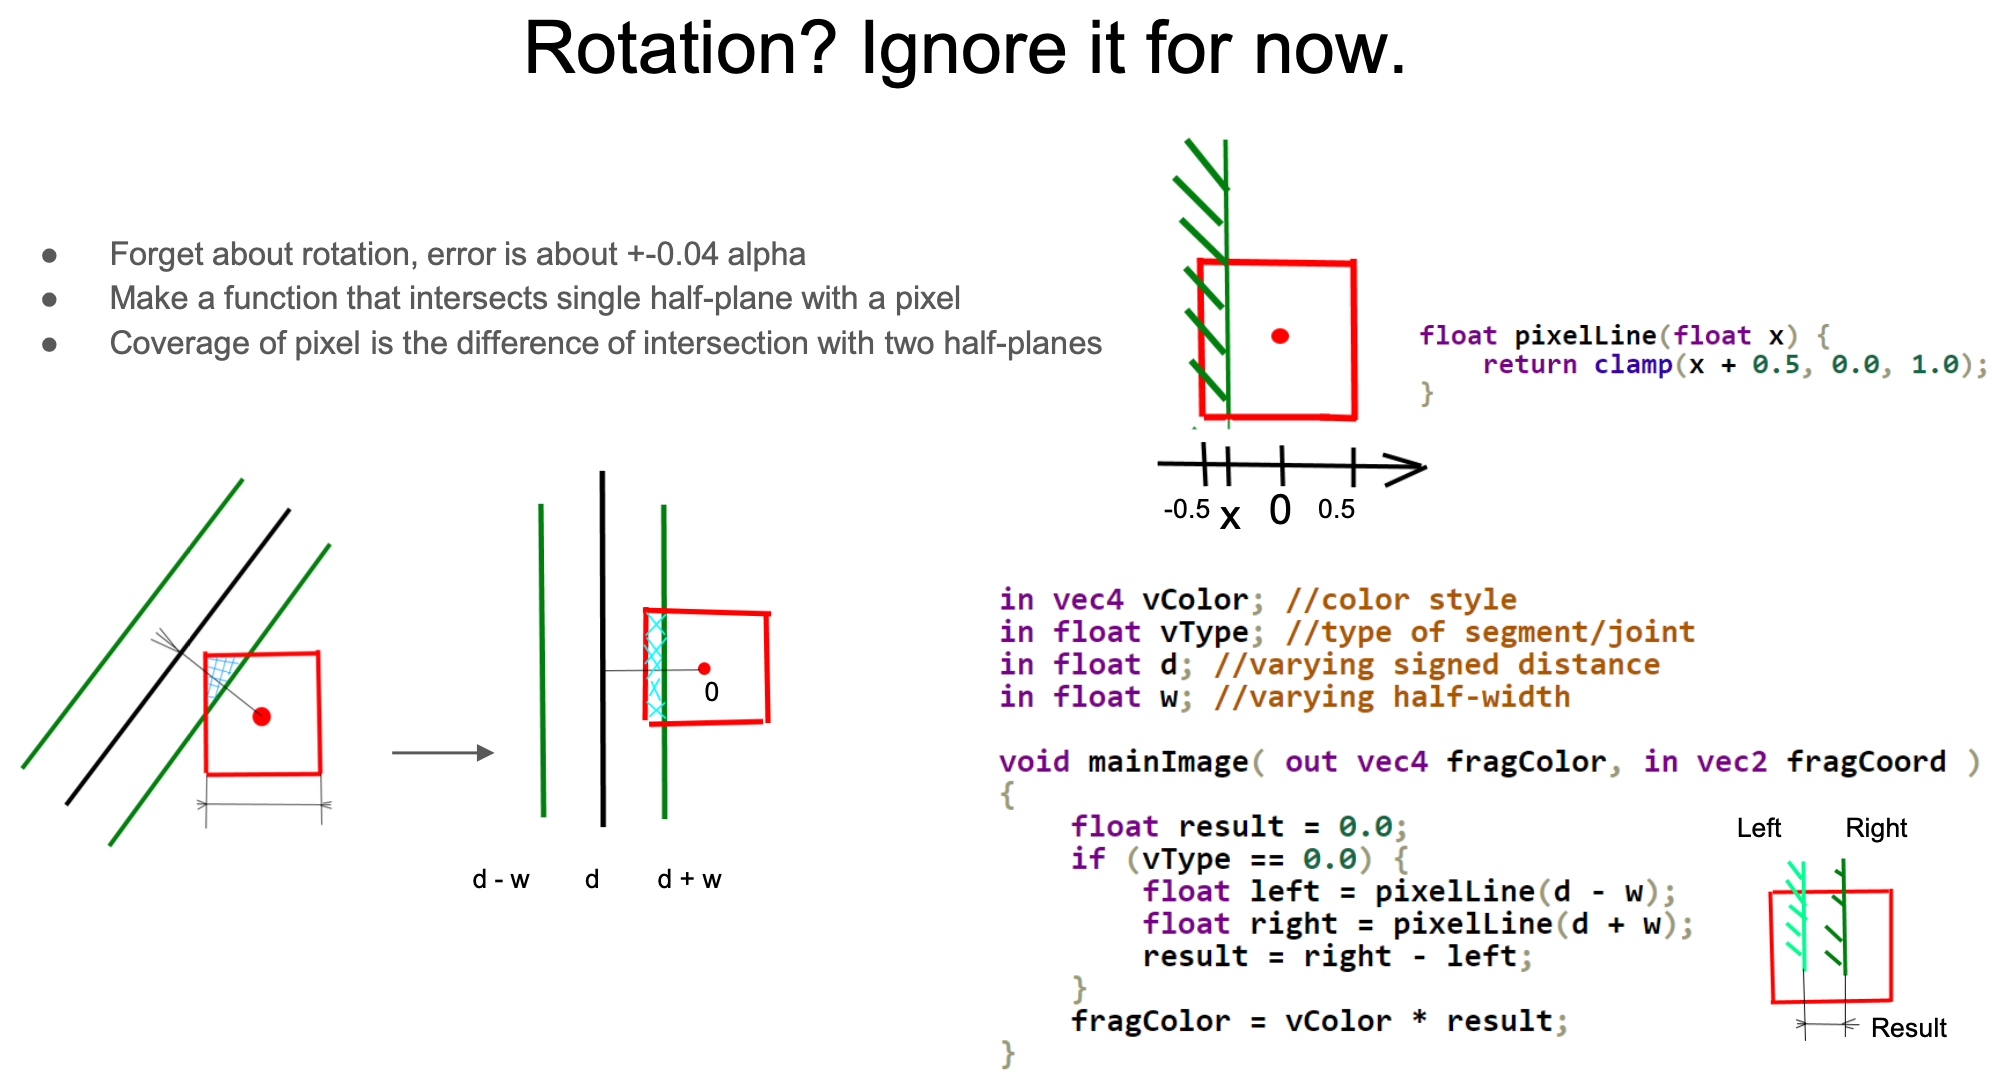
首先来看线段主体的情况,它还可以进一步简化成垂直线段的情况,原作者也提供了考虑旋转的计算方式,与简化的估算版本相差不大。利用 clamp 计算单边的覆盖度,另外考虑非常小的线宽情况,将右侧减去左侧得到最终的覆盖度,当作最终颜色的透明度系数。
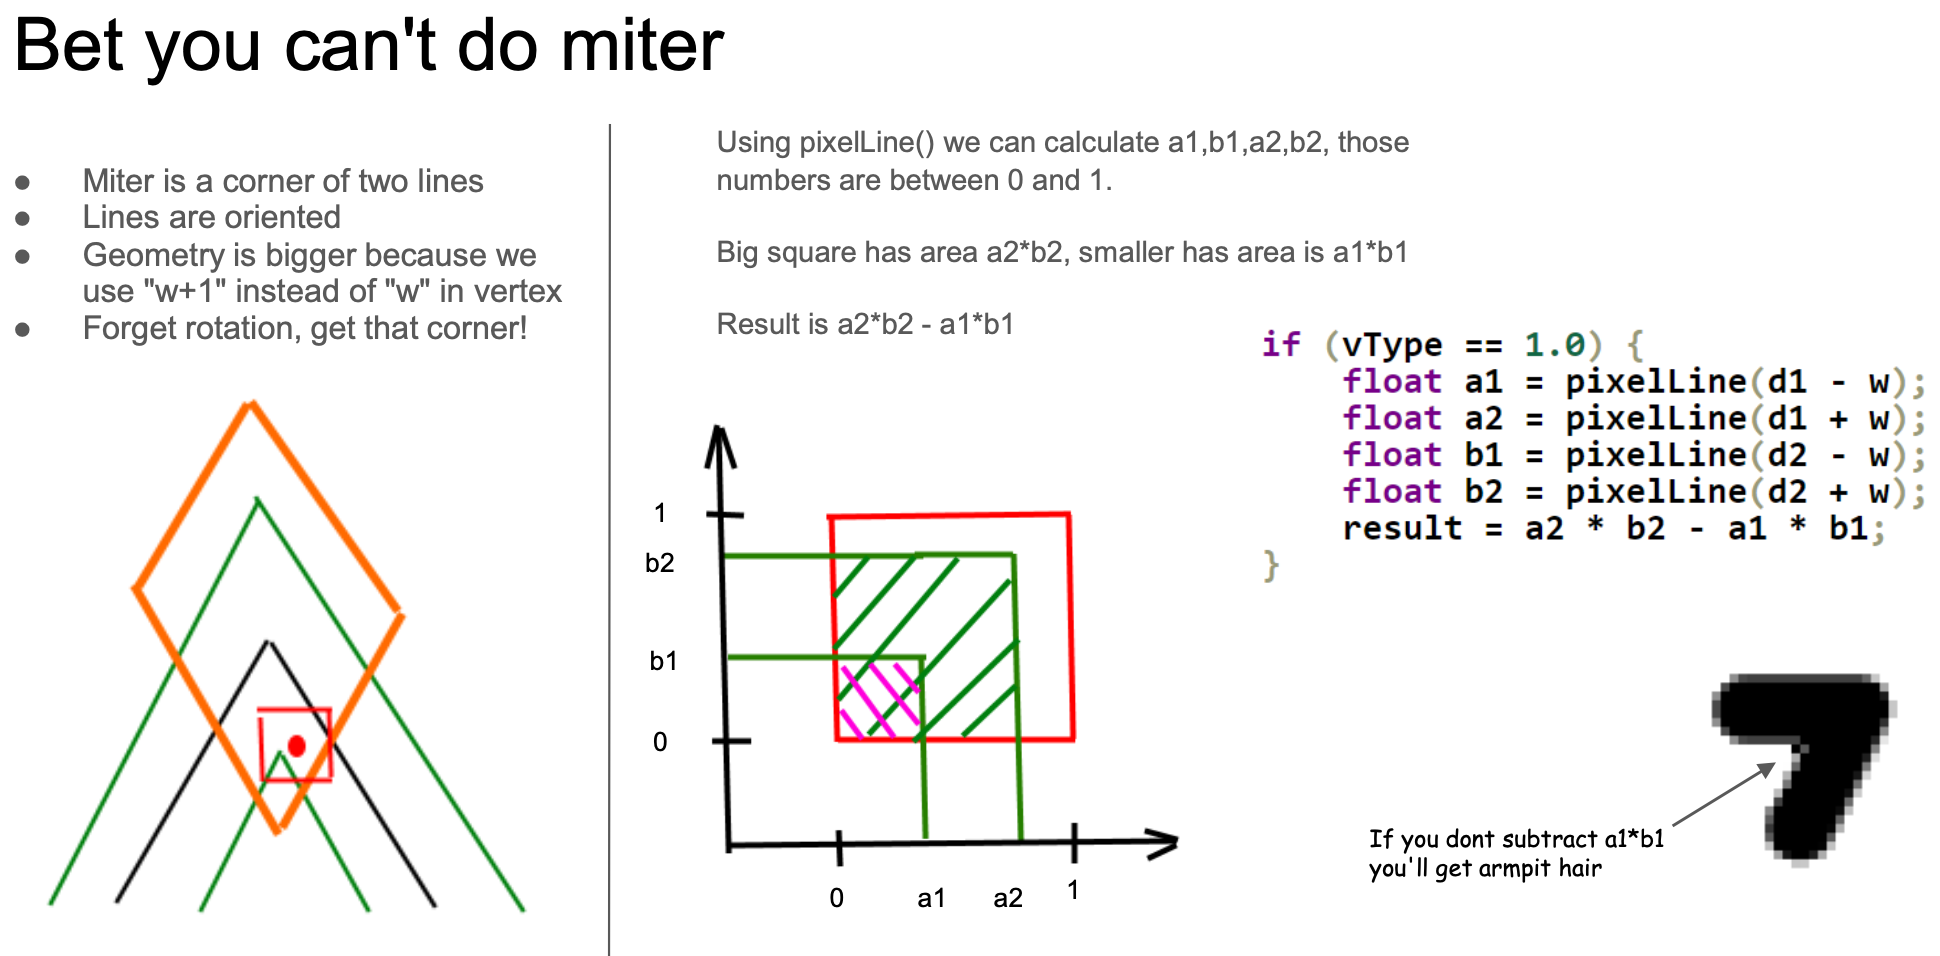
当然计算线段部分和直线的相交区域是最简单的情况。接头和端点处的处理会非常复杂,以 Miter 接头为例,依然先忽略旋转仅考虑相邻线段垂直的情况(注意下图右侧的红色方框区域),不同于上面线段仅存在 d 这一个有向距离的情况,这里出现了 d1 和 d2 两个有向距离分别代表接头前后两段线段。同样考虑到一个像素区域内非常细的线,此时覆盖面积就是大小两个正方形的面积差(a2 * b2 - a1 * b1):
Bevel 接头的计算方式大致和 Miter 相同(下图中间情况)。d3 代表像素点中心到 "bevel line" 的距离,使用它可以计算下图右侧情况的覆盖度。可以取这两种情况的最小值得到近似计算结果。
最后来到圆角接头的情况。需要额外从 Vertex Shader 传递圆心到像素点的距离(类似 SDF 绘制圆)d3。
原作者还提供了精确版本的 pixelLine 实现,限于篇幅就不展开了。
支持 stroke-alignment
之前我们在使用 SDF 绘制的 Circle、Ellipse、Rect 上实现了:增强 SVG: Stroke alignment。现在让我们为折线也加上这个属性。下图来自 Pixi.js 中的 lineStyle.alignment 效果,红色线条表示折线的几何位置,根据取值不同在它上下浮动:
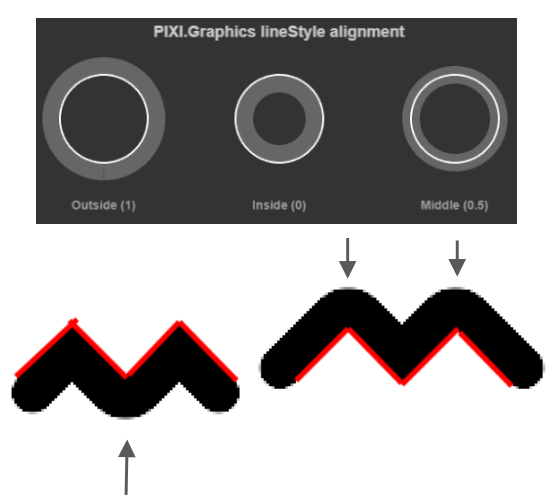
在 Shader 中我们将这个属性反映到沿法线拉伸的偏移量上,如果 strokeAlignment 取值为 center 时偏移量为 0:
float shift = strokeWidth * strokeAlignment;
pointA += norm * shift;
pointB += norm * shift;
从左往右依次是 outer center 和 inner 的效果:
$icCanvas2 = call(() => {
    return document.createElement('ic-canvas-lesson12');
});call(() => {
const { Canvas, Polyline } = Lesson12;
const stats = new Stats();
stats.showPanel(0);
const $stats = stats.dom;
$stats.style.position = 'absolute';
$stats.style.left = '0px';
$stats.style.top = '0px';
$icCanvas2.parentElement.style.position = 'relative';
$icCanvas2.parentElement.appendChild($stats);
$icCanvas2.addEventListener('ic-ready', (e) => {
const canvas = e.detail;
const polyline1 = new Polyline({
points: [
[100, 100],
[100, 200],
[200, 200],
[200, 100],
],
stroke: 'black',
strokeWidth: 20,
strokeAlignment: 'outer',
fill: 'none',
cursor: 'pointer',
});
canvas.appendChild(polyline1);
const polyline4 = new Polyline({
points: [
[100, 100],
[100, 200],
[200, 200],
[200, 100],
],
stroke: 'red',
strokeWidth: 2,
// strokeAlignment: 'outer',
fill: 'none',
});
canvas.appendChild(polyline4);
const polyline2 = new Polyline({
points: [
[220, 100],
[220, 200],
[320, 200],
[320, 100],
],
stroke: 'black',
strokeWidth: 20,
cursor: 'pointer',
fill: 'none',
});
canvas.appendChild(polyline2);
const polyline5 = new Polyline({
points: [
[220, 100],
[220, 200],
[320, 200],
[320, 100],
],
stroke: 'red',
strokeWidth: 2,
fill: 'none',
});
canvas.appendChild(polyline5);
const polyline3 = new Polyline({
points: [
[360, 100],
[360, 200],
[460, 200],
[460, 100],
],
stroke: 'black',
strokeWidth: 20,
strokeAlignment: 'inner',
fill: 'none',
cursor: 'pointer',
});
canvas.appendChild(polyline3);
const polyline6 = new Polyline({
points: [
[360, 100],
[360, 200],
[460, 200],
[460, 100],
],
stroke: 'red',
strokeWidth: 2,
fill: 'none',
});
canvas.appendChild(polyline6);
polyline1.addEventListener('pointerenter', () => {
polyline1.stroke = 'green';
});
polyline1.addEventListener('pointerleave', () => {
polyline1.stroke = 'black';
});
polyline2.addEventListener('pointerenter', () => {
polyline2.stroke = 'green';
});
polyline2.addEventListener('pointerleave', () => {
polyline2.stroke = 'black';
});
polyline3.addEventListener('pointerenter', () => {
polyline3.stroke = 'green';
});
polyline3.addEventListener('pointerleave', () => {
polyline3.stroke = 'black';
});
});
$icCanvas2.addEventListener('ic-frame', (e) => {
stats.update();
});
});最后还有两点需要注意:
- 由于
stroke-alignment并非 SVG 标准属性,因此在导出成 SVG 时需要重新计算points,和 Shader 中沿法线、角平分线拉伸逻辑一致,限于篇幅就不展开了 - 拾取判定方法即
containsPoint同样需要依据points计算偏移后的顶点。可以在上面的例子中尝试将鼠标移入移出改变折线的颜色
虚线
首先计算每个顶点从起点处经过的距离,以 [[0, 0], [100, 0], [200, 0]] 的折线为例,三个 instance 的 a_Travel 的值依次为 [0, 100, 200]。在 Vertex Shader 中计算拉伸后顶点经过的距离:
layout(location = ${Location.TRAVEL}) in float a_Travel;
out float v_Travel;

v_Travel = a_Travel + dot(pos - pointA, vec2(-norm.y, norm.x));
在 Fragment Shader 中,将 stroke-dasharray 和 stroke-dashoffset 的值传入,和 SVG 标准不同,我们暂时仅支持长度为 2 的 stroke-dasharray,即 [10, 5, 2] 这样的虚线暂不支持。
in float v_Travel;

/**
虚线模式重复单元:
┌─────────────────┬─────────┬─────────────────┐
│   Gap/2         │  Dash   │   Gap/2         │
│  (透明)          │ (不透明) │  (透明)         │
└─────────────────┴─────────┴─────────────────┘
       ↑                          ↑
      -0.5                   Dash+0.5
   (抗锯齿边界)            (抗锯齿边界)
 */
float u_Dash = u_StrokeDash.x;
float u_Gap = u_StrokeDash.y;
float u_DashOffset = u_StrokeDash.z;
if (u_Dash + u_Gap > 1.0) {
    /**
    travel 值的含义:
  < -0.5          : 间隔区域(alpha = 0)
  -0.5 ~ 0        : 虚线起始边缘(平滑过渡)
  0 ~ Dash        : 虚线段(alpha = 1)
  Dash ~ Dash+0.5 : 虚线结束边缘(平滑过渡)
  > Dash+0.5      : 间隔区域(alpha = 0)
     */
  float travel = mod(v_Travel + u_Gap * v_ScalingFactor * 0.5 + u_DashOffset, u_Dash * v_ScalingFactor + u_Gap * v_ScalingFactor) - (u_Gap * v_ScalingFactor * 0.5);
  float left = max(travel - 0.5, -0.5);
  float right = min(travel + 0.5, u_Gap * v_ScalingFactor + 0.5);
  alpha *= antialias(max(0.0, right - left));
}
我们还可以实时改变(自增) stroke-dashoffset 实现蚂蚁线效果。通常这类动画效果会通过 SVG 同名属性实现,详见:How to animate along an SVG path at the same time the path animates?
$icCanvas3 = call(() => {
    return document.createElement('ic-canvas-lesson12');
});call(() => {
const { Canvas, Polyline } = Lesson12;
const stats = new Stats();
stats.showPanel(0);
const $stats = stats.dom;
$stats.style.position = 'absolute';
$stats.style.left = '0px';
$stats.style.top = '0px';
$icCanvas3.parentElement.style.position = 'relative';
$icCanvas3.parentElement.appendChild($stats);
let polyline1;
$icCanvas3.addEventListener('ic-ready', (e) => {
const canvas = e.detail;
polyline1 = new Polyline({
points: [
[100, 100],
[100, 200],
[200, 200],
[200, 100],
],
stroke: 'black',
strokeWidth: 20,
strokeDasharray: [10, 10],
strokeDashoffset: 0,
fill: 'none',
cursor: 'pointer',
});
canvas.appendChild(polyline1);
const polyline2 = new Polyline({
points: [
[300, 100],
[300, 200],
[500, 200],
[500, 100],
],
stroke: 'black',
strokeWidth: 10,
strokeDasharray: [2, 10],
strokeDashoffset: 0,
strokeLinecap: 'round',
strokeLinejoin: 'round',
fill: 'none',
cursor: 'pointer',
});
canvas.appendChild(polyline2);
polyline1.addEventListener('pointerenter', () => {
polyline1.stroke = 'green';
});
polyline1.addEventListener('pointerleave', () => {
polyline1.stroke = 'black';
});
});
$icCanvas3.addEventListener('ic-frame', (e) => {
stats.update();
polyline1.strokeDashoffset += 0.1;
});
});另一种实现方式使用 fract(),详见:Pure WebGL Dashed Line。
按照 SVG 规范,stroke-dasharray 和 stroke-dashoffset 这两个属性也可以作用在 Circle / Ellipse / Rect 等其他图形上。因此当这两个属性有合理值时,原本使用 SDF 绘制的描边就得改成使用 Polyline 实现。以 Rect 为例,最多可能需要 3 个 drawcall 分别绘制外阴影、矩形主体和虚线描边:
SHAPE_DRAWCALL_CTORS.set(Rect, [ShadowRect, SDF, SmoothPolyline]);以 Rect 为例,我们需要根据 x / y / width / height 属性人为构造一条折线,其中包含 6 个顶点。值得注意的是,前 5 个其实已经可以完成闭合,但我们额外增加一个 [x + epsilon, y] 用来完成最后的 strokeLinejoin。Circle 和 Ellipse 同理,只不过为了保证平滑多增加一些采样点(这里我们使用 64):
if (object instanceof Polyline) {
    points = object.points.reduce((prev, cur) => {
        prev.push(cur[0], cur[1]);
        return prev;
    }, [] as number[]);
} else if (object instanceof Rect) {
    const { x, y, width, height } = object;
    points = [
        x,
        y,
        x + width,
        y,
        x + width,
        y + height,
        x,
        y + height,
        x,
        y,
        x + epsilon,
        y,
    ];
}$icCanvas5 = call(() => {
return document.createElement('ic-canvas-lesson12');
});call(() => {
const { Canvas, Rect, Circle, Ellipse } = Lesson12;
const stats = new Stats();
stats.showPanel(0);
const $stats = stats.dom;
$stats.style.position = 'absolute';
$stats.style.left = '0px';
$stats.style.top = '0px';
$icCanvas5.parentElement.style.position = 'relative';
$icCanvas5.parentElement.appendChild($stats);
$icCanvas5.addEventListener('ic-ready', (e) => {
const canvas = e.detail;
const rect = new Rect({
x: 50,
y: 50,
fill: 'black',
fillOpacity: 0.5,
dropShadowBlurRadius: 10,
dropShadowColor: 'black',
dropShadowOffsetX: 10,
dropShadowOffsetY: 10,
stroke: 'red',
strokeWidth: 10,
});
rect.width = 100;
rect.height = 100;
canvas.appendChild(rect);
const rect2 = new Rect({
x: 200,
y: 50,
fill: 'black',
fillOpacity: 0.5,
stroke: 'red',
strokeWidth: 10,
dropShadowBlurRadius: 10,
dropShadowColor: 'black',
dropShadowOffsetX: 10,
dropShadowOffsetY: 10,
strokeDasharray: [5, 5],
});
rect2.width = 100;
rect2.height = 100;
canvas.appendChild(rect2);
const circle = new Circle({
cx: 400,
cy: 100,
r: 50,
fill: 'black',
stroke: 'red',
strokeWidth: 20,
strokeDasharray: [5, 5],
});
canvas.appendChild(circle);
const circle2 = new Circle({
cx: 550,
cy: 100,
r: 50,
fill: 'black',
stroke: 'red',
strokeWidth: 20,
strokeDasharray: [5, 20],
strokeAlignment: 'inner',
});
canvas.appendChild(circle2);
const ellipse = new Ellipse({
cx: 150,
cy: 250,
rx: 100,
ry: 50,
fill: 'black',
stroke: 'red',
strokeWidth: 20,
strokeDasharray: [5, 5],
});
canvas.appendChild(ellipse);
});
$icCanvas5.addEventListener('ic-frame', (e) => {
stats.update();
});
});计算包围盒
让我们从渲染中暂时跳出,做一些几何运算。正如之前的课程中介绍的,在拾取和剔除中都需要计算包围盒。
先忽略绘制属性例如线宽,几何包围盒的计算非常简单。只需要找到折线所有顶点中的最小和最大坐标:
const minX = Math.min(...points.map((point) => point[0]));
const maxX = Math.max(...points.map((point) => point[0]));
const minY = Math.min(...points.map((point) => point[1]));
const maxY = Math.max(...points.map((point) => point[1]));
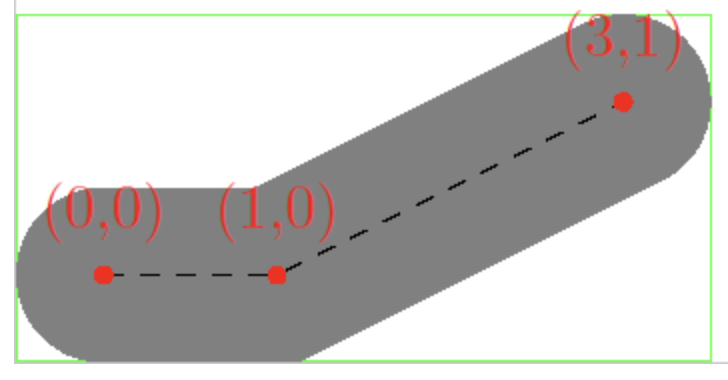
return new AABB(minX, minY, maxX, maxY);一旦涉及到线宽、端点和接头,计算折线的包围盒就会变的比较复杂。如果不需要太精确的结果,可以简单将上述包围盒向外延拓一半的线宽。Calculate bounding box of line with thickness 中使用了 Cairo 提供的 cairo-stroke-extents 方法,如果线宽为 0,它就会退化成 cairo-path-extents:
Computes a bounding box in user coordinates covering the area that would be affected, (the "inked" area)
继续深入查看 Cairo 源码可以发现针对 stroke 包围盒它也提供了两种方法(这里省略了大量参数),前者使用估计方法因此速度较快,后者会考虑端点、接头的具体形态完成精确计算:
cairo_private void
_cairo_path_fixed_approximate_stroke_extents ();

cairo_private cairo_status_t
_cairo_path_fixed_stroke_extents ();
快速估计
这种估计是指在几何包围盒基础上沿水平和垂直方向各向外拓展一定距离:style_expansion * strokeWidth。
/*
 * For a stroke in the given style, compute the maximum distance
 * from the path that vertices could be generated.  In the case
 * of rotation in the ctm, the distance will not be exact.
 */
void
_cairo_stroke_style_max_distance_from_path (const cairo_stroke_style_t *style,
         const cairo_path_fixed_t *path,
                                            const cairo_matrix_t *ctm,
                                            double *dx, double *dy)
{
    double style_expansion = 0.5;

    if (style->line_cap == CAIRO_LINE_CAP_SQUARE)
 style_expansion = M_SQRT1_2;

    if (style->line_join == CAIRO_LINE_JOIN_MITER &&
 ! path->stroke_is_rectilinear &&
 style_expansion < M_SQRT2 * style->miter_limit)
    {
 style_expansion = M_SQRT2 * style->miter_limit;
    }

    style_expansion *= style->line_width;
}
考虑 stroke-linecap="square" 的情况,下图展示了在最理想的情况下 style_expansion 等于 0.5,即从红色本体向外延展 0.5 * strokeWidth,黑色区域就是该 <polyline> 的包围盒。
但如果折线略微倾斜 45 度,此时向外延展的距离为 sqrt(2) / 2 * strokeWidth:
同理还需要考虑 stroke-linejoin="miter" 的情况。可见这种估计方法并不会精确考虑每一个顶点、接头的情况,仅仅作出最乐观的估计,保证包围盒一定能容纳折线。
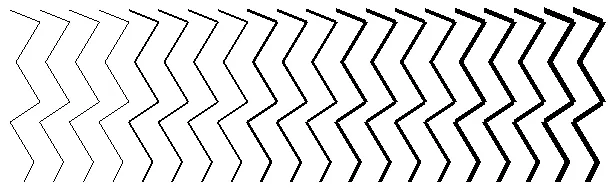
下面我们将折线的包围盒实时绘制出来,从左至右分别展示了 strokeLinecap 的不同取值:
$icCanvas6 = call(() => {
    return document.createElement('ic-canvas-lesson12');
});call(() => {
const { Canvas, Polyline, Rect } = Lesson12;
const stats = new Stats();
stats.showPanel(0);
const $stats = stats.dom;
$stats.style.position = 'absolute';
$stats.style.left = '0px';
$stats.style.top = '0px';
$icCanvas6.parentElement.style.position = 'relative';
$icCanvas6.parentElement.appendChild($stats);
function drawBounds(canvas, polyline) {
const { minX, minY, maxX, maxY } = polyline.getBounds();
const bounds = new Rect({
x: minX,
y: minY,
stroke: 'red',
fill: 'none',
});
bounds.width = maxX - minX;
bounds.height = maxY - minY;
canvas.appendChild(bounds);
}
$icCanvas6.addEventListener('ic-ready', (e) => {
const canvas = e.detail;
const polyline1 = new Polyline({
points: [
[100, 100],
[200, 200],
],
stroke: 'black',
strokeWidth: 20,
fill: 'none',
cursor: 'pointer',
});
canvas.appendChild(polyline1);
drawBounds(canvas, polyline1);
const polyline2 = new Polyline({
points: [
[300, 100],
[400, 200],
],
stroke: 'black',
strokeWidth: 20,
strokeLinecap: 'round',
fill: 'none',
cursor: 'pointer',
});
canvas.appendChild(polyline2);
drawBounds(canvas, polyline2);
const polyline3 = new Polyline({
points: [
[500, 100],
[600, 200],
],
stroke: 'black',
strokeWidth: 20,
strokeLinecap: 'square',
fill: 'none',
cursor: 'pointer',
});
canvas.appendChild(polyline3);
drawBounds(canvas, polyline3);
});
$icCanvas6.addEventListener('ic-frame', (e) => {
stats.update();
});
});精确计算
如果确实想精确计算呢?Cairo 的思路是先转换成 Polygon,再计算它的包围盒:
cairo_status_t
_cairo_path_fixed_stroke_extents (const cairo_path_fixed_t *path,
      const cairo_stroke_style_t *stroke_style,
      const cairo_matrix_t  *ctm,
      const cairo_matrix_t  *ctm_inverse,
      double    tolerance,
      cairo_rectangle_int_t  *extents)
{
    cairo_polygon_t polygon;
    cairo_status_t status;
    cairo_stroke_style_t style;

    _cairo_polygon_init (&polygon, NULL, 0);
    status = _cairo_path_fixed_stroke_to_polygon (path,
        stroke_style,
        ctm, ctm_inverse,
        tolerance,
        &polygon);
    _cairo_box_round_to_rectangle (&polygon.extents, extents);
    _cairo_polygon_fini (&polygon);

    return status;
}
性能测试
来测试一下性能,展示了若干条各包含 20000 个点的折线:
$icCanvas4 = call(() => {
    return document.createElement('ic-canvas-lesson12');
});call(() => {
const { Canvas, Polyline } = Lesson12;
const stats = new Stats();
stats.showPanel(0);
const $stats = stats.dom;
$stats.style.position = 'absolute';
$stats.style.left = '0px';
$stats.style.top = '0px';
$icCanvas4.parentElement.style.position = 'relative';
$icCanvas4.parentElement.appendChild($stats);
let polyline1;
$icCanvas4.addEventListener('ic-ready', (e) => {
const canvas = e.detail;
const data = new Array(20000)
.fill(undefined)
.map((_, i) => [i, Math.random() * 50]);
polyline1 = new Polyline({
points: data,
stroke: 'black',
strokeWidth: 2,
fill: 'none',
cursor: 'pointer',
});
canvas.appendChild(polyline1);
const data2 = new Array(20000)
.fill(undefined)
.map((_, i) => [i, Math.random() * 50 + 100]);
polyline2 = new Polyline({
points: data2,
stroke: 'black',
strokeWidth: 2,
strokeLinejoin: 'round',
fill: 'none',
cursor: 'pointer',
});
canvas.appendChild(polyline2);
const data3 = new Array(20000)
.fill(undefined)
.map((_, i) => [i, Math.random() * 50 + 200]);
polyline3 = new Polyline({
points: data3,
stroke: 'black',
strokeWidth: 2,
strokeDasharray: [4, 4],
fill: 'none',
cursor: 'pointer',
});
canvas.appendChild(polyline3);
});
$icCanvas4.addEventListener('ic-frame', (e) => {
stats.update();
});
});看似还不错,但仔细考虑后仍存在以下问题,可以作为后续的改进方向:
- 由于每个 Instance 使用了 15 个顶点,Buffer 又存在大小限制,因此单根折线中包含的顶点数目实际是有限的
- 目前一根折线对应一个 Drawcall,如果存在大量同类重复的折线呢?regl-gpu-lines 提供了两种思路:
- 一个 Drawcall 也可以绘制多条折线,使用
[NaN, NaN]表示断点,示例:Multiple lines - 如果多条折线顶点数据都相同,只有偏移量差异,此时可以把每条折线都当作一个 Instance,当然每条折线内部的顶点就需要展开了,示例:Fake instancing
- 一个 Drawcall 也可以绘制多条折线,使用
- 根据当前相机缩放等级简化顶点
下面我们按照以上思路继续优化。
包含多段的折线
按照之前减少 Drawcall 数量的优化思路,我们可以将多段折线拼接在一起,当然需要使用某种分隔符,参考 regl-gpu-lines 我们使用 [NaN, NaN]。并且我们很快就会在后续绘制路径时使用它:一条路径中可能包含多条子路径。
Polyline1: [[0, 0], [100, 100]]
Polyline2: [[100, 0], [200, 100]]
MultiPolyline: [[0, 0], [100, 100], [NaN, NaN], [100, 0], [200, 100]]
按照分隔符拆分后,针对每一段依然按照上述方式构建顶点数组:
const subPaths = [];
let lastNaNIndex = 0;
for (let i = 0; i < points.length; i += stridePoints) {
    if (isNaN(points[i]) || isNaN(points[i + 1])) {
        subPaths.push(points.slice(lastNaNIndex, i));
        lastNaNIndex = i + 2;
    }
}
subPaths.push(points.slice(lastNaNIndex));
subPaths.forEach((points) => {
    // 同样的构建顶点数组逻辑
});
效果如下,有以下注意点:
- 由于多段折线合并成了一条,拾取也会按照一个整体进行。可以尝试将鼠标悬停在下面的三组折线上
- 导出成 SVG 时,无法再直接导出成对应的
<polyline>元素
$icCanvas7 = call(() => {
    return document.createElement('ic-canvas-lesson12');
});call(() => {
const { Canvas, Polyline } = Lesson12;
const stats = new Stats();
stats.showPanel(0);
const $stats = stats.dom;
$stats.style.position = 'absolute';
$stats.style.left = '0px';
$stats.style.top = '0px';
$icCanvas7.parentElement.style.position = 'relative';
$icCanvas7.parentElement.appendChild($stats);
$icCanvas7.addEventListener('ic-ready', (e) => {
const canvas = e.detail;
const data = new Array(200).fill(undefined).map((_, i) => [
[Math.random() * 200, Math.random() * 200],
[Math.random() * 200, Math.random() * 200],
[NaN, NaN],
]);
const polyline = new Polyline({
points: data.flat(1),
stroke: 'black',
strokeWidth: 2,
strokeLinecap: 'round',
cursor: 'pointer',
});
canvas.appendChild(polyline);
polyline.addEventListener(
'pointerenter',
() => (polyline.stroke = 'red'),
);
polyline.addEventListener(
'pointerleave',
() => (polyline.stroke = 'black'),
);
const data2 = new Array(200).fill(undefined).map((_, i) => [
[Math.random() * 200 + 200, Math.random() * 200],
[Math.random() * 200 + 200, Math.random() * 200],
[NaN, NaN],
]);
const polyline2 = new Polyline({
points: data2.flat(1),
stroke: 'black',
strokeWidth: 2,
strokeLinecap: 'round',
cursor: 'pointer',
});
canvas.appendChild(polyline2);
polyline2.addEventListener(
'pointerenter',
() => (polyline2.stroke = 'green'),
);
polyline2.addEventListener(
'pointerleave',
() => (polyline2.stroke = 'black'),
);
const data3 = new Array(200).fill(undefined).map((_, i) => [
[Math.random() * 200 + 400, Math.random() * 200],
[Math.random() * 200 + 400, Math.random() * 200],
[NaN, NaN],
]);
const polyline3 = new Polyline({
points: data3.flat(1),
stroke: 'black',
strokeWidth: 2,
strokeLinecap: 'round',
cursor: 'pointer',
});
canvas.appendChild(polyline3);
polyline3.addEventListener(
'pointerenter',
() => (polyline3.stroke = 'blue'),
);
polyline3.addEventListener(
'pointerleave',
() => (polyline3.stroke = 'black'),
);
});
$icCanvas7.addEventListener('ic-frame', (e) => {
stats.update();
});
});[WIP] 合并同类折线
顶点简化
对于包含大量顶点的折线(以及后续的 Path 和 Polygon),一个很重要的优化手段就是根据当前的缩放等级进行简化,尽可能减少渲染数据量。简化的依据有二:
- 太短的线段 和 太小的多边形 都可以直接过滤掉
- 一根折线中对整体形状影响较小的顶点可以过滤掉
线段顶点简化的基础算法是 Ramer–Douglas–Peucker algorithm,思路如下:
- 首先保留 Polyline 的首尾两个顶点并连线
- 找到剩余顶点中距离这条线段最远的顶点,保留该距离
- 如果该距离小于阈值,丢弃
- 如果该距离大于阈值,保留。并和首尾两个端点分割成两个子线段
- 分治法处理两个子线段,回到 1
下图(来自 wiki)演示了这个过程:红点被丢弃,绿点被保留。

显然阈值(ε)选取的越大,最后简化后留下的顶点数(n)就越少,Polyline 也就越不平滑:

基于该算法的 JS 实现有很多:simplify-js,turf-simplify,geojson-vt 等等,我们以 geojson-vt 的实现为例:
export default function simplify(coords, first, last, sqTolerance) {
    let maxSqDist = sqTolerance; // 最大距离
    const mid = (last - first) >> 1; // 找到中点 index
    let minPosToMid = last - first;
    let index; // 最大距离顶点 index

    // 两端点
    const ax = coords[first];
    const ay = coords[first + 1];
    const bx = coords[last];
    const by = coords[last + 1];

    // 找到和线段距离最大的点
    for (let i = first + 3; i < last; i += 3) {
        // 计算顶点到线段的距离平方
        const d = getSqSegDist(coords[i], coords[i + 1], ax, ay, bx, by);
        if (d > maxSqDist) {
            index = i;
            maxSqDist = d;
        }
    }

    // 将距离(平方)与阈值进行比较
    if (maxSqDist > sqTolerance) {
        // 递归处理前一半线段
        if (index - first > 3) simplify(coords, first, index, sqTolerance);
        // 保存最大距离,表示这个顶点需要被保留
        coords[index + 2] = maxSqDist;
        // 递归处理后一半线段
        if (last - index > 3) simplify(coords, index, last, sqTolerance);
    }
}
后续在 课程 25 - 使用折线实现笔刷模式 中我们也会使用这个方法。
其他问题
至此,我们完成了折线的基础绘制工作,最后让我们来看一下其他相关问题,限于篇幅有些问题等到后续课程中再详细展开。
SizeAttenuation
在一些场景中,我们不希望图形随相机缩放改变大小,例如 Figma 中选中图形后展示的包围盒线框以及下方的尺寸标签:
这在 Three.js 中称作:sizeAttenuation,在 Perspective 投影模式下,Sprite 随相机深度变大而变小。等后续我们实现选中 UI 的时候再来实现。
Line Path 和 Polygon
在 SVG 中还存在 <line> <path> 和 <polygon> 这三种元素,其中:
<line>并不需要考虑strokeLinejoin,因此可以简化顶点使用的数量<polygon>的填充部分可以使用一些三角化算法例如 earcut 后绘制,描边部分和折线完全相同<path>也可以采用类似<rect><circle>的方式,在路径上进行采样,最终使用折线绘制,但会存在这样的问题:Draw arcs, arcs are not smooth ISSUE
在下一节课中我们会详细介绍如何绘制它们。