课程 13 - 绘制 Path & 手绘风格
在上一节课中我们介绍了折线的绘制方法,Path 的描边部分理论上可以通过采样转换成折线的绘制,p5js - bezierDetail() 就是这么做的,如果要实现平滑的效果就需要增加采样点。但填充部分仍需要实现。在本节课中我们将介绍:
- 尝试使用 SDF 绘制
- 通过三角化后的网格绘制填充部分,使用折线绘制描边部分
- 实现一些手绘风格图形
$icCanvas = call(() => {
    return document.createElement('ic-canvas-lesson13');
});call(() => {
const {
Canvas,
Path,
RoughCircle,
RoughRect,
deserializeNode,
fromSVGElement,
TesselationMethod,
} = Lesson13;
const stats = new Stats();
stats.showPanel(0);
const $stats = stats.dom;
$stats.style.position = 'absolute';
$stats.style.left = '0px';
$stats.style.top = '0px';
$icCanvas.parentElement.style.position = 'relative';
$icCanvas.parentElement.appendChild($stats);
$icCanvas.addEventListener('ic-ready', (e) => {
const canvas = e.detail;
const circle = new RoughCircle({
cx: 600,
cy: 100,
r: 50,
fill: 'black',
strokeWidth: 2,
stroke: 'red',
fillStyle: 'zigzag',
});
canvas.appendChild(circle);
const rect = new RoughRect({
x: 550,
y: 200,
fill: 'black',
strokeWidth: 2,
stroke: 'red',
fillStyle: 'dots',
});
rect.width = 100;
rect.height = 50;
canvas.appendChild(rect);
fetch(
'/Ghostscript_Tiger.svg',
// '/photo-camera.svg',
).then(async (res) => {
const svg = await res.text();
const $container = document.createElement('div');
$container.innerHTML = svg;
const $svg = $container.children[0];
for (const child of $svg.children) {
const group = await deserializeNode(fromSVGElement(child));
group.children.forEach((path) => {
path.cullable = false;
});
group.position.x = 100;
group.position.y = 75;
canvas.appendChild(group);
const group2 = await deserializeNode(fromSVGElement(child));
group2.children.forEach((path) => {
path.tessellationMethod = TesselationMethod.LIBTESS;
path.cullable = false;
});
group2.position.x = 300;
group2.position.y = 75;
canvas.appendChild(group2);
}
});
});
$icCanvas.addEventListener('ic-frame', (e) => {
stats.update();
});
});一些基础概念
与 Polyline 的区别
首先来明确一下 SVG 中对于 Paths 的定义,尤其是它和 <polyline> 的区别,来自 MDN:
The <path> element is the most powerful element in the SVG library of basic shapes. It can be used to create lines, curves, arcs, and more.
While <polyline> and <path> elements can create similar-looking shapes, <polyline> elements require a lot of small straight lines to simulate curves and don't scale well to larger sizes.
因此用 <polyline> 表现曲线时会存在不够平滑的现象,下图来自:Draw arcs, arcs are not smooth ISSUE

但反过来使用 Path 却可以通过类似 d="M 100 100 L 200 200 L 200 100" 实现折线。
子路径
除了简单的路径例如一条线、一段曲线,单个 <path> 也可以包含一系列的线或者曲线,也可以称作子路径(subpath)。
每个子路径都以一个移动到(moveto)命令开始,通常是 M 或 m,这告诉绘图工具移动到坐标系中的一个新位置,而不会画线。随后可以跟随一系列的绘制命令,比如线段(L 或 l)、水平线段(H 或 h)、垂直线段(V 或 v)、曲线(C、S、Q、T 等)和弧线(A 或 a)。
使用 SDF 绘制
之前我们使用 SDF 绘制了 Circle Ellipse 和 Rect,能否针对 Path 也这么做呢?
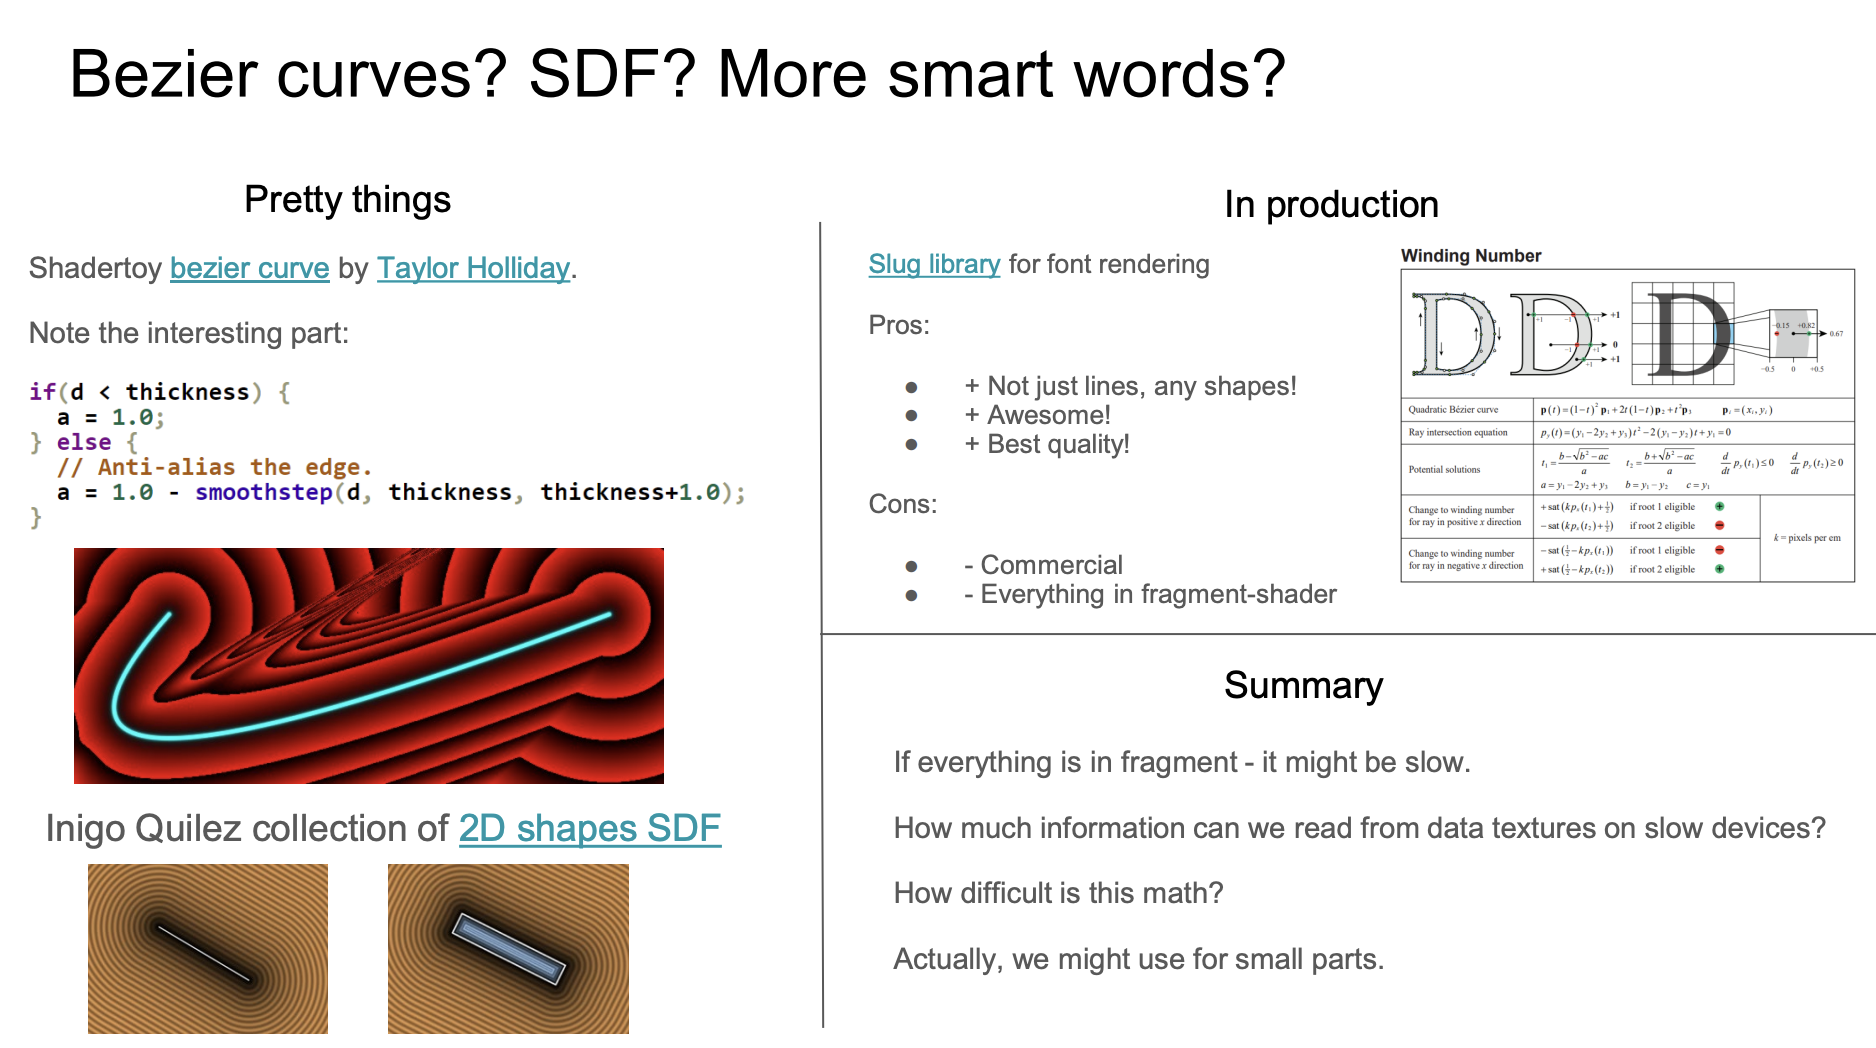
对于简单的 Path 似乎可行,例如在上节课中原作者的 PPT 中也提到了 shadertoy 上的 Quadratic Bezier - distance 2D,对一段单独的贝塞尔曲线确实可行,但对于复杂 Path 就无能为力了,而且在 Fragment Shader 中进行过于复杂的数学运算也会影响性能。

Path2D
svg-path-sdf 给出了另一种思路,有趣的是它和后续我们将要介绍的文本绘制思路几乎完全相同。OB 上有一个在线示例:SDF Points with regl

Canvas2D API 中的 fill() 和 stroke() 可以接受 Path2D 作为参数,后者可以通过 SVG 路径定义直接创建。随后使用 Canvas2D API 生成 SDF 作为纹理传入,具体生成方式可以参考 tiny-sdf,我们会在后续介绍文本绘制时详细介绍它。
// @see https://github.com/dy/svg-path-sdf/blob/master/index.js#L61C3-L63C31
var path2d = new Path2D(path);
ctx.fill(path2d);
ctx.stroke(path2d);

var data = bitmapSdf(ctx);
当然 Path2D 是浏览器环境才原生支持的 API,如果想在服务端渲染中使用,需要使用 polyfill,详见:Support Path2D API。
使用网格绘制
因此对于 Path 常规的方式还是三角化,无论是 2D 还是 3D。下面的示例来自:SVG loader in three.js。首先将 SVG 文本转换成一组 ShapePath,然后创建一组 ShapeGeometry 并渲染:
const shapes = SVGLoader.createShapes(path);
for (const shape of shapes) {
    const geometry = new THREE.ShapeGeometry(shape);
    const mesh = new THREE.Mesh(geometry, material);
    mesh.renderOrder = renderOrder++;

    group.add(mesh);
}
下面让我们来实现自己的版本:
- 将路径定义规范到绝对命令
- 在曲线上采样
- 使用 Polyline 绘制描边
- 使用 earcut 和 libtess 三角化,绘制填充
转换成绝对路径
SVG 路径命令包含绝对和相对两种,例如:M 100 100 L 200 100 和 M 100 100 l 100 0 是等价的。为了便于后续处理,我们先将相对命令都转换成绝对命令。Canvas2D API 也采用这种风格,类似 lineTo,我们参考 Three.js 的 ShapePath 实现,它实现了一系列 CanvasRenderingContext2D 的方法例如 moveTo / lineTo / bezierCurveTo 等等。
import { path2Absolute } from '@antv/util';

const path = new ShapePath();
const commands = path2Absolute(d);
commands.forEach((command) => {
    const type = command[0];
    const data = command.slice(1);
    switch (type) {
        case 'M':
            path.moveTo();
        case 'L':
            path.lineTo();
        //...
    }
});
下面我们简单介绍下 ShapePath 提供的方法,它包含一组 subPath 对应路径定义中的多条命令。以 moveTo 和 lineTo 为例,前者会创建一条新的 subPath 并设置起点,后者完成到下一个点的连线。
export class ShapePath {
    currentPath: Path | null;
    subPaths: Path[];

    moveTo(x: number, y: number) {
        this.currentPath = new Path();
        this.subPaths.push(this.currentPath);
        this.currentPath.moveTo(x, y);
        return this;
    }

    lineTo(x: number, y: number) {
        this.currentPath.lineTo(x, y);
        return this;
    }
}
下面来看每一个 subPath 的结构。
export class Path extends CurvePath {}在曲线上采样
针对直线、贝塞尔曲线进行不同精度的采样。这也很好理解:对于贝塞尔曲线,只有增加更多的采样点才能让折线看起来更平滑;对于直线没必要额外增加任何采样点。
export class CurvePath extends Curve {
    getPoints(divisions = 12) {
        const resolution =
            curve instanceof EllipseCurve
                ? divisions * 2
                : curve instanceof LineCurve
                ? 1
                : divisions;
        const pts = curve.getPoints(resolution);
    }
}
以三阶贝塞尔曲线为例,给定归一化后的 t,采样点就可以通过其定义得到 Bézier_curve:
export class CubicBezierCurve extends Curve {
    getPoint(t: number) {
        const point = vec2.create();
        const { v0, v1, v2, v3 } = this;

        vec2.set(
            point,
            CubicBezier(t, v0[0], v1[0], v2[0], v3[0]),
            CubicBezier(t, v0[1], v1[1], v2[1], v3[1]),
        );

        return point;
    }
}
这里有一个圆形 Path 的例子,采样后的顶点列表如下:
points = call(() => {
    const { Path } = Lesson13;
    return new Path({
        d: 'M40,0A40,40 0 1,1 0,-40A40,40 0 0,1 40,0Z',
        fill: 'black',
        opacity: 0.5,
    }).points;
});
使用 Polyline 绘制描边
现在我们已经有了所有 subPath 上的采样点,可以分别绘制填充和描边。前者我们马上就会介绍到,而后者可以直接使用上一节课实现的 Polyline,包含多段的折线刚好可以支持一系列的 subPath。
SHAPE_DRAWCALL_CTORS.set(Path, [Mesh, SmoothPolyline]);使用 earcut 三角化

那么如何分割三角形呢?一种常见的方法叫做「ear clipping」。如果一个顶点相邻的两个顶点连线不与多边形的任何一边相交,那么这个顶点就构成了「ear」。 我们以下图左侧为例,在这个判断标准下,v2 v4 和 v5 就是「ear」。然后移除找到的 ear 如 v4,继续判定其相邻的顶点 v5 和 v3,其中 v5 构成了 ear。以此类推最终所有的 ear 都被移除,多边形也最终被分割成多个三角形。

详细算法可参考论文:Triangulation By Ear Clipping,而 earcut 提供了一种 JS 实现:
function isEar(ear) {
    var a = ear.prev,
        b = ear,
        c = ear.next;

    if (area(a, b, c) >= 0) return false; // reflex, can't be an ear

    // now make sure we don't have other points inside the potential ear
    var p = ear.next.next;

    while (p !== ear.prev) {
        // 处于三角形中,不是 ear
        if (
            pointInTriangle(a.x, a.y, b.x, b.y, c.x, c.y, p.x, p.y) &&
            area(p.prev, p, p.next) >= 0
        )
            return false;
        p = p.next;
    }

    return true;
}
使用 earcut 完成三角化,输入采样点坐标得到索引数组,甚至还可以计算误差。稍后在与其他三角化方式对比时可以看到,earcut 大幅提升了计算速度但损失一定的精确性:
import earcut, { flatten, deviation } from 'earcut';

const { d } = path;
const { subPaths } = parsePath(d);
const points = subPaths
    .map((subPath) => subPath.getPoints().map((point) => [point[0], point[1]]))
    .flat(2); // [100, 100, 200, 200, 300, 100, 100, 100]

const { vertices, holes, dimensions } = flatten(points);
const indices = earcut(vertices, holes, dimensions); // [1, 3, 2]
const err = deviation(vertices, holes, dimensions, indices); // 0
这样我们就可以使用 gl.drawElements() 或者 passEncoder.drawIndexed() 完成绘制了。下图中左侧 Path 定义如下,和右侧使用 SDF 绘制的 Circle 对比后可以看出边缘其实并不平滑,在相机放大后更为明显:
const path = new Path({
    d: 'M40,0A40,40 0 1,1 0,-40A40,40 0 0,1 40,0Z',
    fill: 'black',
    opacity: 0.5,
});$icCanvas2 = call(() => {
return document.createElement('ic-canvas-lesson13');
});call(() => {
const { Canvas, Path, Circle } = Lesson13;
const stats = new Stats();
stats.showPanel(0);
const $stats = stats.dom;
$stats.style.position = 'absolute';
$stats.style.left = '0px';
$stats.style.top = '0px';
$icCanvas2.parentElement.style.position = 'relative';
$icCanvas2.parentElement.appendChild($stats);
$icCanvas2.addEventListener('ic-ready', (e) => {
const canvas = e.detail;
canvas.camera.zoom = 2;
const path = new Path({
d: 'M40,0A40,40 0 1,1 0,-40A40,40 0 0,1 40,0Z',
fill: 'black',
opacity: 0.5,
});
path.position.x = 100;
path.position.y = 100;
canvas.appendChild(path);
const circle = new Circle({
cx: 0,
cy: 0,
r: 40,
fill: 'black',
opacity: 0.5,
});
circle.position.x = 200;
circle.position.y = 100;
canvas.appendChild(circle);
});
$icCanvas2.addEventListener('ic-frame', (e) => {
stats.update();
});
});我发现很多 2D 渲染引擎例如 vello 都会使用 Ghostscript Tiger.svg 来测试对于 Path 的渲染效果,在本文开头的示例中就可以看到。但如果和原始 SVG 仔细对比(还记得我们实现的导出功能吗?它就在画布右上角),会发现缺失了一些部分。
其他三角化方案
Pixi.js 使用了 earcut 进行多边形的三角化。其他三角化库还有 cdt2d 和 libtess.js,后者虽然性能不佳,但胜在精确性,尤其是针对包含大量 holes 以及自我交叠的路径。正如 earcut 在其文档中提到的,详见 Ability to substitute earcut for libtess.js for a given Graphics object:
If you want to get correct triangulation even on very bad data with lots of self-intersections and earcut is not precise enough, take a look at libtess.js.
Polygon Tesselation 中也对比了 earcut 和 libtess.js 的效果。与 earcut 返回索引数组不同,libtess.js 返回的是顶点数组,具体使用方式可以参考代码仓库的示例。这意味着我们需要手动生成索引数组,当然这非常简单:由于不需要考虑顶点的复用,使用一个从 0 开始的递增数组即可。
export function triangulate(contours: [number, number][][]) {
    tessy.gluTessNormal(0, 0, 1);

    const triangleVerts = [];
    tessy.gluTessBeginPolygon(triangleVerts);
    // Omit...
    return triangleVerts;
}

triangulate(points); // [100, 0, 0, 100, 0, 0, 0, 100, 100, 0, 100, 100]
// indices: [0, 1, 2, 3, 4, 5]
可以回到文章开头的“两只老虎”示例对比查看,左侧是使用 earcut 生成的,右侧是 libtess.js 生成的。我们为 Path 添加了一个 tessellationMethod 属性用来在两种三角化方式间切换:
export enum TesselationMethod {
    EARCUT,
    LIBTESS,
}
export interface PathAttributes extends ShapeAttributes {
    tessellationMethod?: TesselationMethod;
}
绘制孔洞
在 SVG 中可以这样定义孔洞,与轮廓的时针方向不同。比如下面路径中的轮廓为顺时针 M0 0 L100 0 L100 100 L0 100 Z,后续的两个孔洞就是逆时针方向:
M0 0 L100 0 L100 100 L0 100 Z M50 50 L50 75 L75 75 L75 50 Z M25 25 L25当然也可以将时针方向反过来定义,例如:Draw a hollow circle in SVG,总之孔洞的时针方向与轮廓相反即可。
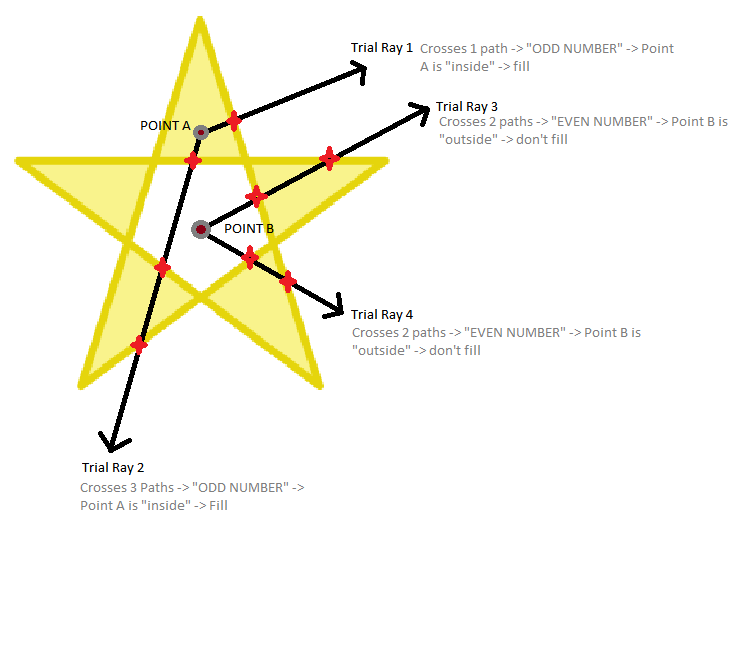
填充规则
SVG 中的 fill-rule 用来判定 Path 的填充区域,下面的例子中左边是 nonzero,右边是 evenodd。
以中心挖空区域中的点为例,作射线与图形的交点为偶数,因此判定为图形外部,无需填充。详见 how does fill-rule="evenodd" work on a star SVG。

由于 earcut 不支持自相交路径,我们使用 libtess.js 来三角化路径。
tessy.gluTessProperty(
    libtess.gluEnum.GLU_TESS_WINDING_RULE,
    fillRule === 'evenodd'
        ? libtess.windingRule.GLU_TESS_WINDING_ODD
        : libtess.windingRule.GLU_TESS_WINDING_NONZERO,
);
包围盒与拾取
包围盒可以沿用上一节课针对折线的估计方式。我们重点关注如何判定点是否在 Path 内的实现。
使用原生方法
CanvasRenderingContext2D 提供了 isPointInPath 和 isPointInStroke 这两个开箱即用的方法,配合我们之前介绍过的 Path2D 可以很容易地进行判定。
const canvas = document.getElementById('canvas');
const ctx = canvas.getContext('2d');
const isPointInPath = ctx.isPointInPath(new Path2D(d), x, y);
之前我们介绍过 OffscreenCanvas,对于拾取判定这种与主线程渲染任务无关的计算,特别适合交给它完成。在 PickingPlugin 中我们完成初始化,随后传入 containsPoint 中供具体图形按需调用:
export class Picker implements Plugin {
    private ctx: OffscreenCanvasRenderingContext2D | CanvasRenderingContext2D;

    private hitTest(shape: Shape, wx: number, wy: number): boolean {
        if (shape.hitArea || shape.renderable) {
            shape.worldTransform.applyInverse(
                { x: wx, y: wy },
                tempLocalPosition,
            );
            const { x, y } = tempLocalPosition;

            return shape.containsPoint(x, y);
            return shape.containsPoint(x, y, this.ctx);
        }

        return false;
    }
}
几何方法
针对 Path 的每一个 subPath 都可以进行它与点位置关系的几何运算。例如 Pixi.js 就实现了 GraphicsContext - containsPoint,感兴趣可以深入阅读。
手绘风格
excalidraw 使用了 rough 进行手绘风格的绘制。我们并不需要 rough 默认提供的基于 Canvas2D 或 SVG 的实际绘制功能,使因此使用 RoughGenerator 是更好的选择。
生成手绘路径定义
RoughGenerator 为常见图形提供了生成方法,以矩形为例:
const generator = rough.generator();
const rect = generator.rectangle(0, 0, 100, 100);
它能根据输入参数为我们生成一组类似 subPath 的结构,rough 称作 OpSet,它包含 move lineTo 和 bcurveTo 三种操作符。我们可以很容易地将它转换成包含绝对路径的命令,随后进行采样就可以继续使用 Polyline 绘制了。
import { AbsoluteArray } from '@antv/util';
import { OpSet } from 'roughjs/bin/core';

export function opSet2Absolute(set: OpSet) {
    const array = [];
    set.ops.forEach(({ op, data }) => {
        if (op === 'move') {
            array.push(['M', data[0], data[1]]);
        } else if (op === 'lineTo') {
            array.push(['L', data[0], data[1]]);
        } else if (op === 'bcurveTo') {
            array.push([
                'C',
                data[0],
                data[1],
                data[2],
                data[3],
                data[4],
                data[5],
            ]);
        }
    });
    return array as AbsoluteArray;
}
Rough Mixin
在包围盒计算、拾取这些功能上我们希望复用非手绘版本,理由如下:
- 这种风格化渲染仅应当影响渲染效果,并不改变它的物理属性
- 手绘图形实际由若干组 Path 组成,精确计算包围盒反而是种性能浪费
- 在拾取时应当作为一个整体,按 Path 判断反而会获得错误的效果,例如鼠标明明悬停在图形内部,但却因为处在线条之间的空白处从而导致判定不在图形内
因此我们创建一个新的 Mixin,它包含 rough 支持的全部参数例如 seed roughness 等等,当这些参数发生改变立刻执行重绘:
import { Drawable, Options } from 'roughjs/bin/core';
import { GConstructor } from '.';
import { parsePath } from '../../utils';

export interface IRough
    extends Omit<Options, 'stroke' | 'fill' | 'strokeWidth'> {
    /**
     * @see https://github.com/rough-stuff/rough/wiki#roughness
     */
    roughness: Options['roughness'];
}
export function Rough<TBase extends GConstructor>(Base: TBase) {
    abstract class Rough extends Base implements IRough {
        get roughness() {
            return this.#roughness;
        }
        set roughness(roughness: number) {
            if (this.#roughness !== roughness) {
                this.#roughness = roughness;
                this.renderDirtyFlag = true;
                this.generate();
            }
        }
    }
}
这样我们已经支持的图形只需要用它包装一下即可获得手绘效果。使用方式如下,以 RoughRect 为例,它继承自 Rect:
import { RectWrapper, RectAttributes } from './Rect';

export class RoughRect extends Rough(RectWrapper(Shape)) {}
fillStyle solid
为了支持 fillStyle = 'solid' 的情况:
SHAPE_DRAWCALL_CTORS.set(RoughRect, [
    ShadowRect,
    Mesh, // fillStyle === 'solid'
    SmoothPolyline, // fill
    SmoothPolyline, // stroke
]);$icCanvas3 = call(() => {
return document.createElement('ic-canvas-lesson13');
});call(() => {
const { Canvas, RoughCircle } = Lesson13;
const stats = new Stats();
stats.showPanel(0);
const $stats = stats.dom;
$stats.style.position = 'absolute';
$stats.style.left = '0px';
$stats.style.top = '0px';
$icCanvas3.parentElement.style.position = 'relative';
$icCanvas3.parentElement.appendChild($stats);
const circle1 = new RoughCircle({
cx: 100,
cy: 100,
r: 50,
fill: 'black',
strokeWidth: 2,
stroke: 'red',
fillStyle: 'dots',
});
const circle2 = new RoughCircle({
cx: 200,
cy: 100,
r: 50,
fill: 'black',
strokeWidth: 2,
stroke: 'red',
fillStyle: 'hachure',
});
const circle3 = new RoughCircle({
cx: 300,
cy: 100,
r: 50,
fill: 'black',
strokeWidth: 2,
stroke: 'red',
fillStyle: 'zigzag',
});
const circle4 = new RoughCircle({
cx: 400,
cy: 100,
r: 50,
fill: 'black',
strokeWidth: 2,
stroke: 'red',
fillStyle: 'cross-hatch',
});
const circle5 = new RoughCircle({
cx: 500,
cy: 100,
r: 50,
fill: 'black',
strokeWidth: 2,
stroke: 'red',
fillStyle: 'solid',
});
const circle6 = new RoughCircle({
cx: 100,
cy: 200,
r: 50,
fill: 'black',
strokeWidth: 2,
stroke: 'red',
fillStyle: 'dashed',
});
const circle7 = new RoughCircle({
cx: 200,
cy: 200,
r: 50,
fill: 'black',
strokeWidth: 2,
stroke: 'red',
fillStyle: 'zigzag-line',
});
$icCanvas3.addEventListener('ic-ready', (e) => {
const canvas = e.detail;
canvas.appendChild(circle1);
canvas.appendChild(circle2);
canvas.appendChild(circle3);
canvas.appendChild(circle4);
canvas.appendChild(circle5);
canvas.appendChild(circle6);
canvas.appendChild(circle7);
});
$icCanvas3.addEventListener('ic-frame', (e) => {
stats.update();
});
});导出 SVG
可以看出 rough 生成的图形都是由一组 Path 组成。因此在导出成 SVG 时需要使用 <path>。可以在上面的示例中尝试导出:
export function exportRough(
    node: SerializedNode,
    $g: SVGElement,
    doc: Document,
) {
    const {
        attributes: { drawableSets, stroke, fill },
    } = node;

    drawableSets.forEach((drawableSet) => {
        const { type } = drawableSet;
        const commands = opSet2Absolute(drawableSet);
        const d = path2String(commands, 2); // retain two decimal places
        const $path = createSVGElement('path', doc);
        $path.setAttribute('d', d);
        $g.appendChild($path);
        if (type === 'fillSketch') {
            $path.setAttribute('stroke', fill as string);
            $path.setAttribute('fill', 'none');
        }
    });
}