Lesson 10 - Importing and Exporting Images
Image import and export is a very important feature in Infinite Canvas, and through the exported image it can be interfaced with other tools. So while our canvas drawing capabilities are currently limited, it's good to think ahead about issues related to images. In this lesson you will learn the following:
- Exporting canvas content to PNG, JPEG, and SVG, and exporting time-based effects to GIF
- Rendering images in the canvas, including
object-fit/object-positionon image fills - Extending the capabilities of SVG, using
stroke-alignmentas an example.
Exporting canvas contents to image
First, let's look at how to export the contents of a canvas to an image. The article Export from Figma describes how to export a canvas to various formats including PNG using the slice tool in Figma.
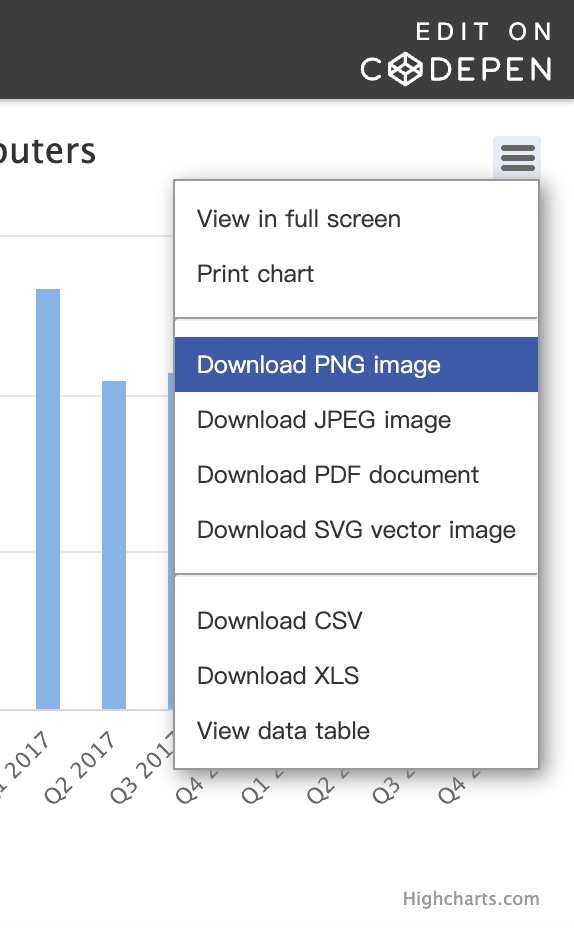
Some charting libraries based on Canvas2D implementations also provide the ability to save content to an image. The image below is from Highcharts, and you can see that it also provides the ability to export images in a variety of formats, which triggers the browser's download behavior immediately after clicking:
We would like to implement the following export functionality:
- Support for multiple image formats: PNG, JPEG and SVG.
- Support for specifying the cropping area
- Support for selecting whether to include a grid or not
To do this we have designed the image exporter to be used in the following way:
const exporter = new ImageExporter({
    canvas,
});

const canvas = await exporter.toCanvas(); // HTMLCanvasElement
const dataURL = canvas.toDataURL(); // data:...

exporter.downloadImage({
    dataURL,
    name: 'my-file',
});
However, there is a “slight” difference for different formats of images, below we first introduce the way of exporting PNG / JPEG format images.
Export PNG / JPEG
HTMLCanvasElement.toDataURL() 可以获取画布内容对应的图片 DataURI,通过 type 参数可以指定图片格式,支持 PNG / JPEG 和 WebP。
var canvas = document.getElementById('canvas');
var dataURL = canvas.toDataURL(); // 默认为 PNG
console.log(dataURL);
// "data:image/png;base64,iVBORw0KGgoAAAANSUhEUgAAAAUAAAAFCAYAAACNby
// blAAAADElEQVQImWNgoBMAAABpAAFEI8ARAAAAAElFTkSuQmCC"
So we add a toCanvas method to the image exporter. This method is used to draw the canvas content of the specified area into an additional HTMLCanvasElement, which can then be further manipulated as needed, e.g. by adding a background color, a watermark, etc. The full method signature is below. It's worth noting that this method is asynchronous, and we'll explain why later:
toCanvas(options: Partial<CanvasOptions> = {}): Promise<HTMLCanvasElement>;

interface CanvasOptions {
  grid: boolean;
  clippingRegion: Rectangle;
  beforeDrawImage: (context: CanvasRenderingContext2D) => void;
  afterDrawImage: (context: CanvasRenderingContext2D) => void;
}
The meaning of each configuration item is as follows:
gridWhether to include a gridclippingRegionThe canvas clipping region, represented by a rectangle.beforeDrawImageCalled before drawing the content of the canvas, suitable for drawing the background color.afterDrawImageCalled after drawing the content of the canvas, suitable for drawing watermarks.
The complete usage example is as follows:
const canvas = await exporter.toCanvas({
    clippingRegion: new Rectangle(
        clippingRegionX,
        clippingRegionY,
        clippingRegionWidth,
        clippingRegionHeight,
    ),
    beforeDrawImage: (context) => {
        // Customize background-color
        context.fillStyle = backgroundColor;
        context.fillRect(0, 0, clippingRegionWidth, clippingRegionHeight);
    },
    afterDrawImage: (context) => {
        // Watermark
        context.font = '24px Times New Roman';
        context.fillStyle = '#FFC82C';
        context.fillText('Watermark', 20, 20);
    },
});
We have placed the Export Image dropdown in the top right corner of the canvas, if interested in components you can refer to: Web UI with Lit and Shoelace.
$icCanvas = call(() => {
    return document.createElement('ic-canvas-lesson10');
});call(() => {
const { Canvas, Circle } = Lesson10;
const stats = new Stats();
stats.showPanel(0);
const $stats = stats.dom;
$stats.style.position = 'absolute';
$stats.style.left = '0px';
$stats.style.top = '0px';
$icCanvas.parentElement.style.position = 'relative';
$icCanvas.parentElement.appendChild($stats);
$icCanvas.addEventListener('ic-ready', (e) => {
const canvas = e.detail;
for (let i = 0; i < 100; i++) {
const fill = `rgb(${Math.floor(Math.random() * 255)},${Math.floor(
Math.random() * 255,
)},${Math.floor(Math.random() * 255)})`;
const circle = new Circle({
cx: Math.random() * 600,
cy: Math.random() * 400,
r: Math.random() * 40,
fill,
});
canvas.appendChild(circle);
circle.addEventListener('pointerenter', () => {
circle.fill = 'red';
});
circle.addEventListener('pointerleave', () => {
circle.fill = fill;
});
}
});
$icCanvas.addEventListener('ic-frame', (e) => {
stats.update();
});
});Now let's answer why the toCanvas method is designed to be asynchronous. Since WebGL / WebGPU uses the SwapChain double buffering mechanism, and the default value of preserveDrawingBuffer is false when creating the context, you need to make sure that the rendering is not cleared (e.g., by calling gl.clear()) when calling toDataURL, otherwise you will get a blank image. We add the following logic to the endFrame hook in Plugin-based architecture to save the contents of the canvas as soon as the export command is received, before the end of the current frame, in case it is cleared when the next frame arrives, which would cause the behavior to become asynchronous.
hooks.endFrame.tap(() => {
    this.#device.endFrame();

    // capture here since we don't preserve drawing buffer
    if (this.#enableCapture && this.#resolveCapturePromise) {
        const { type, encoderOptions } = this.#captureOptions;
        const dataURL = (
            this.#swapChain.getCanvas() as HTMLCanvasElement
        ).toDataURL(type, encoderOptions);
        this.#resolveCapturePromise(dataURL);
        this.#enableCapture = false;
        this.#captureOptions = undefined;
        this.#resolveCapturePromise = undefined;
    }
});
In addition, you can choose whether or not to include Grid in the exported image. For the time being, we don't use the cropping and watermarking functions for subsequent processing. Since the implementation of a Figma-like “slicing” feature requires a box-select interaction, it will be introduced in a later implementation. Now let's go back to another special image format.
Export SVG
The advantages of vector graphics over bitmaps are:
- Infinite scaling without distortion. This means that they can be scaled up or down indefinitely without losing clarity, making them ideal for situations where multiple resolutions are required.
- Editability: SVGs are text files that can be edited with any text editor, making it easy to modify the attributes and style of the graphic.
- SVGs are text files that can be edited with any text editor, making it easy to modify the attributes and styles of graphics.
Therefore, design tools must provide support for conversion to this format. For our infinite canvas, we can convert the problem to: How to serialize the scene graph, including the drawing attributes of each node, transformations and so on. As for the format of the serialization, besides JSON, since the design of the drawing properties of our 2D graphs itself heavily references SVG implementations, it's only natural to export to SVG.
Interestingly, Three.js also provides toJSON to save the current state of the scene (including objects, transforms, materials, etc.) as JSON-Object-Scene-format-4. It even includes a SVGRenderer to render 3D graphics as best as possible under limited conditions (no complex shading, shadows).
Shape to SerializedNode
Many whiteboard tools also provide custom graphic serialization formats, such as JSON objects in tldraw and JSON schema in excalidraw.
Traversed from the root node of the scene graph, recursively called on child elements. Attributes such as transform with complex structural values (position/scale/rotation) require further processing:
function serializeNode(node: Shape): SerializedNode {
    const [type, attributes] = typeofShape(node);
    const data: SerializedNode = {
        type,
        attributes,
    };
    data.attributes.transform = serializeTransform(node.transform);
    data.children = node.children.map(serializeNode);
    return data;
}
Take the Circle below as an example, we get its serialized object:
serializedCircle = call(() => {
    const { Circle, serializeNode } = Lesson10;
    const circle = new Circle({
        cx: 100,
        cy: 100,
        r: 50,
        fill: 'red',
    });
    circle.transform.position.x = 100;
    return serializeNode(circle);
});
It can be imported into the canvas via the deserialize method, deserializeNode creates the corresponding graph based on the type attribute of the serialized node, assigning values to the drawing attributes:
canvas2 = (async () => {
    const { Canvas } = Lesson10;

    const canvas = await Utils.createCanvas(Canvas, 200, 200);

    let id;
    const animate = () => {
        canvas.render();
        id = requestAnimationFrame(animate);
    };
    animate();

    unsubscribe(() => {
        cancelAnimationFrame(id);
        canvas.destroy();
    });

    return canvas;
})();call(async () => {
const { deserializeNode } = Lesson10;
const circle = await deserializeNode(serializedCircle);
canvas2.root.appendChild(circle);
return canvas2.getDOM();
});The serialization and deserialization methods for the entire canvas can just be applied to the root node, but of course event listeners cannot be serialized:
const json = JSON.stringify(serializeNode(canvas.root)); // {}
canvas.root = (await deserializeNode(JSON.parse(json))) as Group;
From SerializedNode to SVGElement
At this point it is easy to convert the serialized node to SVG Element. We add the following tool method:
export function toSVGElement(node: SerializedNode): SVGElement;Most of the attributes such as fill / stroke / opacity are SVG attributes with the same name, so they can be assigned directly using setAttribute, but there are some special attributes that need to be handled in a special way, for example:
transformWe use theTransformobject in@pixi/math, and we need itsposition / rotation / scaleto be converted tomatrix().transform-origincorresponds to thepivotattribute intransform.innerShadowdoes not have the SVG property of the same name, it needs to be implemented using a filter.outerShadowSame as above
The following example shows the effect of a serialized circle converted to a <circle>, which needs to be embedded in <svg> in order to be displayed on an HTML page, with the same dimensions as the canvas:
call(() => {
    const { toSVGElement } = Lesson10;

    const $circle = toSVGElement(serializedCircle);
    const $svg = document.createElementNS('http://www.w3.org/2000/svg', 'svg');
    $svg.setAttribute('width', '200');
    $svg.setAttribute('height', '200');
    $svg.appendChild($circle);

    return $svg;
});
From SVGElement to SerializedNode
Naturally, we also need a conversion method from SVGElement to SerializedNode:
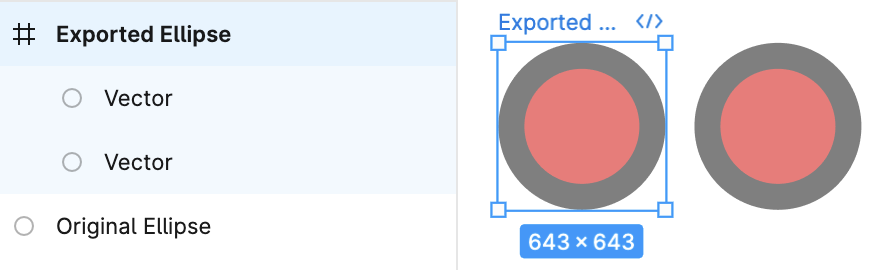
export function fromSVGElement(element: SVGElement): SerializedNode;Note that this conversion is not fully reversible, for example, in the StrokeAlignment implementation we'll cover later, one Circle corresponds to two <circle>s. The same is true in Figma, where the following image shows the import of a previously exported Ellipse effect, and you can see that the two shapes are not identical.
@pixi-essentials/svg also wants to convert SVGElement to shapes in Pixi.js, see Vector rendering of SVG content with PixiJS.
SceneGraph in SVG
Another thing to note is that while any graph in our scene graph can have child nodes, only <g> can have children in SVG, and other than that, e.g. <circle> cannot have children. The solution is simple: for non-Group elements that have children, generate the SVG with a <g> outside it, and apply the transform that would have been applied to it. Assuming we have support for rendering text in the future, the SVG for a Circle with text children would look like this:
<g transform="matrix(1,0,0,0,1,0)">
    <circle cx="100" cy="100" r="100" fill="red" />
    <text />
</g>
Export inner & outerShadow
Referring to Adding Shadows to SVG Icons With CSS and SVG Filters, we use filter primitive to realize inner and outer shadows. Example of outer shadows:
const $feDropShadow = createSVGElement('feDropShadow', doc);
$feDropShadow.setAttribute('dx', `${(dropShadowOffsetX || 0) / 2}`);
$feDropShadow.setAttribute('dy', `${(dropShadowOffsetY || 0) / 2}`);
$feDropShadow.setAttribute(
    'stdDeviation',
    `${(dropShadowBlurRadius || 0) / 4}`,
);
$feDropShadow.setAttribute('flood-color', dropShadowColor);
$filter.appendChild($feDropShadow);
The inner shadows are a bit more complicated, so I won't expand on that for the sake of space. You can download the SVG to see it in the example below:
$icCanvas4 = call(() => {
    return document.createElement('ic-canvas-lesson10');
});call(() => {
const { Canvas, Rect } = Lesson10;
const stats = new Stats();
stats.showPanel(0);
const $stats = stats.dom;
$stats.style.position = 'absolute';
$stats.style.left = '0px';
$stats.style.top = '0px';
$icCanvas4.parentElement.style.position = 'relative';
$icCanvas4.parentElement.appendChild($stats);
$icCanvas4.addEventListener('ic-ready', (e) => {
const canvas = e.detail;
const rect = new Rect({
x: 50,
y: 50,
fill: 'green',
cornerRadius: 50,
batchable: false,
innerShadowColor: 'black',
innerShadowOffsetX: 10,
innerShadowOffsetY: 10,
innerShadowBlurRadius: 10,
dropShadowColor: 'black',
dropShadowOffsetX: 10,
dropShadowOffsetY: 10,
dropShadowBlurRadius: 10,
});
rect.width = 400;
rect.height = 100;
canvas.appendChild(rect);
});
$icCanvas4.addEventListener('ic-frame', (e) => {
stats.update();
});
});Export image as value of fill
Although we haven't covered the implementation of the fill image yet, directly serializing the Image value of the fill property would result in the following:
<circle fill="[object ImageBitmap]" />This obviously won't display properly, we need to serialize the Image object to a DataURL, just draw the image into <canvas> and use the toDataURL method we introduced in the previous section. Referring to Convert ImageBitmap to Blob, I first tried ImageBitmapRenderingContext, ImageBitmap can asynchronously decode the image without blocking the main thread, which helps to improve the performance and responsiveness of the application.
async function imageBitmapToURL(bmp: ImageBitmap) {
    const canvas = document.createElement('canvas');
    // resize it to the size of our ImageBitmap
    canvas.width = bmp.width;
    canvas.height = bmp.height;
    // get a bitmaprenderer context
    const ctx = canvas.getContext('bitmaprenderer');
    ctx.transferFromImageBitmap(bmp);
    const blob = await new Promise<Blob>((res) => canvas.toBlob(res));
    return canvas.toDataURL();
}
Unfortunately we get the following error. The reason for this is that we have already created a texture using this ImageBitmap and we can't transfer control of it to the new <canvas>.
CAUTION
The input ImageBitmap has been detached
So we can only use the regular drawImage method to draw the image into the <canvas>.
Grid in SVG
Finally, let's look at how to implement a grid using SVG. Referring to How to draw grid using HTML5 and canvas or SVG, we use <pattern> tiling: for the straight grid, we use two sets of one and one set of two; for the dot grid, we place a circle in each of the four corners of the “tile”:
Another interesting implementation is through the stroke-dasharray of <line>, which uses fewer SVG elements than the massively repeated <circle>, see Dot Grid With pattern.
Then add a judgment at the draw grid logic: it stays the same in non-screenshot mode, and draws in screenshot mode only when the include grid option is turned on:
hooks.beginFrame.tap(() => {
    if (
        !this.#enableCapture ||
        (this.#enableCapture && this.#captureOptions.grid)
    ) {
        this.#grid.render(this.#device, this.#renderPass, this.#uniformBuffer);
    }
});
Reflecting camera parameters with viewBox
We can place the width and height of the canvas on the <svg> element, but how should the camera's transformation parameters such as translation x/y and zoom (we don't support camera rotation export yet) be reflected in the resulting SVG element?
Here you can use the viewBox:
const { x, y, rotation, zoom } = cameras[0].read(ComputedCamera);
$namespace.setAttribute(
    'viewBox',
    `${x} ${y} ${width / zoom} ${height / zoom}`,
);
SVG Optimizer
If you look closely at current SVG products, you'll see that there are some redundant attributes, such as opacity=“1”, which is a default value and doesn't need to be explicitly present in the product. In fact, this is one of the tools used by SVG optimization tools such as svgo:
SVG files, especially those exported from vector editors, usually contain a lot of redundant information. This includes editor metadata, comments, hidden elements, default or suboptimal values, and other stuff that can be safely removed or converted without impacting rendering.
So we need to maintain a set of mapping tables for default attribute values, and if the attribute value happens to be equal to the default value, we don't need to call setAttribute to set it:
const defaultValues = {
    opacity: 1,
    fillOpacity: 1,
    strokeOpacity: 1,
    fill: 'black',
    stroke: 'none',
};

Object.entries(rest).forEach(([key, value]) => {
    if (`${value}` !== '' && `${defaultValues[key]}` !== `${value}`) {
        element.setAttribute(camelToKebabCase(key), `${value}`);
    }
});
[WIP] Inlined Web font
When exporting to SVG, if web fonts are used, we aim to inline them within the file. Naturally, due to font file size constraints, some on-demand trimming is required during runtime. Below is Excalidraw's processing flow, detailed at: Font subsetting in excalidraw
Export GIF
In a later Lesson 30 - Time-based animation, we cover effects driven by post-processing and a time uniform. To export that motion you need formats such as GIF or MOV; here we outline the former.
- The render path must accept the current frame index (or engine time) so each step shows the right moment of the effect.
- Snapshot the canvas to a raster, e.g. PNG — the previous section already covered that.
- Read pixels and quantize to a palette (e.g. 256 colors per frame). If you can accept a small quality hit, 128 or 64 colors usually shrinks the file a lot; gradients and photo-like content will show more banding or noise.
- Per-frame palettes: the straightforward approach is one
quantizeper frame and onepaletteperwriteFrame, which works well for flat UI. For short loops with little change between frames, a single global palette or fewer keyframes can save more space, at a notably higher implementation cost.
import { GIFEncoder, applyPalette, quantize } from 'gifenc';

const gif = GIFEncoder();
for (let i = 0; i < frameCount; i++) {
    renderFrame(i); // (1) drive time / frame
    const dataUrl = el.toDataURL('image/png', pngQuality); // (2) raster snapshot
    const imageData = await imageDataFromPngDataUrl(dataUrl, w, h, ctx!);
    const palette = quantize(imageData.data, 256); // (3) build palette
    const index = applyPalette(imageData.data, palette); // (4) map to indices
    gif.writeFrame(index, w, h, { palette, delay });
}
gif.finish();
return new Blob([new Uint8Array(gif.bytes())], { type: 'image/gif' });
Export PDF
Now that pixels and vectors are available, if you still want to export to PDF you can use jsPDF, which provides an API for adding images, which I won't cover here for lack of space.
Let's look at another topic, how to render an image in the canvas.
Render Image
In WebGL / WebGPU it is often necessary to load images and use them as textures. Since loading different types of resources is a complex asynchronous process, most rendering engines provide a resource loader. Often there is also support for other data types besides the different types of images, such as audio, JSON, glTF, etc. Below is an example of how PIXI Assets is used:
import { Sprite, Assets } from 'pixi.js';
// load the texture we need
const texture = await Assets.load('bunny.png');

// This creates a texture from a 'bunny.png' image
const bunny = new Sprite(texture);
So how to implement a resource loader?
Image loader
loaders.gl provides a range of loaders for different types of resources, such as:
- JSON, CSV, GeoJSON, GeoTiles, etc. commonly used in visualization applications.
- 3D model formats such as glTF
- Various compressed texture formats, which are loaded and parsed in WebWorker using CompressedTextureLoader.
These loaders provide great convenience for the development of upper layer applications, we can directly use ImageLoader, which supports these image formats: PNG, JPEG, GIF, WEBP, AVIF, BMP, SVG, and so on. core` ensures uniformity in API calls and extensibility for different types of loaders:
import { ImageLoader } from '@loaders.gl/images';
import { load } from '@loaders.gl/core';

const image = await load(url, ImageLoader, options);
In addition to setting the fill attribute directly, you also need to restore the DataURL to an Image object during deserialization:
async function deserializeNode(data: SerializedNode) {
    // data:image/png:base64...
    if (fill && isString(fill) && isDataUrl(fill)) {
        shape.fill = (await load(fill, ImageLoader)) as ImageBitmap;
    }
}
API Design
Going back to the design of our API, we can of course add a new graphic to the image, modeled after Circle / Ellipse / Rect, which corresponds to [<image>] in SVG:
const image = new Image({
    x: 0,
    y: 0,
    width: 100,
    height: 100,
    src: 'data:image...',
});
But if you think about it, an Image should have all the capabilities of a Rect, such as strokes, rounded corners, shadows and so on. Interestingly in Figma if we choose to insert a 1920 * 1920 image into the canvas and export it as an SVG, we get a <rect> element with the following structure (some attribute values are omitted), and the fill attribute references a [<pattern>], which is indirectly using the image tiling fill:
<svg>
    <rect width="500" height="500" fill="url(#pattern0_2442_3)" />
    <defs>
        <pattern id="pattern0_2442_3">
            <use xlink:href="#image0_2442_3"
            <!-- 0.000520833 = 1 / 1920 -->
            transform="matrix(0.000520833 0 0 0.000527058 0 -0.0059761)" />
        </pattern>
        <image
            id="image0_2442_3"
            width="1920"
            height="1920"
            xlink:href="data:image/png;base64,iVBO..."
        />
    </defs>
</svg>
This gives us a bit of an idea that images don't need to exist as separate shapes, as long as the fill attribute of other shapes supports mapping, so that Circle / Rect etc. can use images as fill. Imagine we need to implement a circle icon with a stroke, the original design would require an Image graphic with something like [<clipPath>], but now we just need to fill the existing Circle graphic with an image:
circle.fill = image;
circle.stroke = 'black';
Implementation
So as a first step we extend the types supported by fill from color strings to more texture sources:
export interface IRenderable {
    fill: string;
    fill: string | TexImageSource;
}

type TexImageSource =
    | ImageBitmap
    | ImageData
    | HTMLImageElement
    | HTMLCanvasElement
    | HTMLVideoElement
    | OffscreenCanvas
    | VideoFrame;
A field in the vertex data is needed to indicate if a texture is used, and if so to sample the texture, where SAMPLER_2D() is not the standard GLSL syntax, but our customized markup for replacing it with the GLSL100 / GLSL300 / WGSL sampling syntax at the Shader compilation stage. Also, textures are currently uploaded images, and gradients created using the Canvas2D API such as [createLinearGradient] will be supported later:
// vert
out vec2 v_Uv;
v_Uv = (a_FragCoord * radius / size + 1.0) / 2.0;

// frag
in vec2 v_Uv;
uniform sampler2D u_Texture;

if (useFillImage) {
    fillColor = texture(SAMPLER_2D(u_Texture), v_Uv);
}
The use of uniform breaks our previous batch rendering logic. The [Inside PixiJS: Batch Rendering System] article describes the logic of the BatchRenderer implementation of Pixi.js, and as you can see from the runtime-compiled Shader template below, the maximum number of samplers that can be supported at the same time is a set of %count% samplers, where each instance selects from the set of samplers using the vertex data aTextureId is used by each instance to select from the set of samplers.
// Shader template in Pixi.js BatchRenderer
// vert
attribute int aTextureId;
varying int vTextureId;
vTextureId = aTextureId;

// frag
uniform sampler2D uSamplers[%count%];
varying int vTextureId;
For simplicity, let's simplify the merge logic as follows:
fillwith a color string that cannot be combined with an Image.fillwith a different Image value cannot be combined.
So the following three circles will be drawn in the same batch.
$icCanvas3 = call(() => {
    return document.createElement('ic-canvas-lesson10');
});call(() => {
const { Canvas, Circle } = Lesson10;
const stats = new Stats();
stats.showPanel(0);
const $stats = stats.dom;
$stats.style.position = 'absolute';
$stats.style.left = '0px';
$stats.style.top = '0px';
$icCanvas3.parentElement.style.position = 'relative';
$icCanvas3.parentElement.appendChild($stats);
$icCanvas3.addEventListener('ic-ready', async (e) => {
const image = await Utils.loadImage('/canvas.png');
const canvas = e.detail;
const circle1 = new Circle({
cx: 200,
cy: 200,
r: 50,
fill: image,
stroke: 'black',
strokeWidth: 20,
strokeOpacity: 0.5,
strokeAlignment: 'inner',
});
canvas.appendChild(circle1);
const circle2 = new Circle({
cx: 320,
cy: 200,
r: 50,
fill: image,
stroke: 'black',
strokeWidth: 20,
strokeOpacity: 0.5,
});
canvas.appendChild(circle2);
const circle3 = new Circle({
cx: 460,
cy: 200,
r: 50,
fill: image,
stroke: 'black',
strokeWidth: 20,
strokeOpacity: 0.5,
strokeAlignment: 'outer',
});
canvas.appendChild(circle3);
});
$icCanvas3.addEventListener('ic-frame', (e) => {
stats.update();
});
});Render cache
We haven't considered caching GPU objects like Program, Bindings, Sampler, etc. before. For this reason, we add a resource cache manager to enable reuse, and implement hit logic according to the resource type. Take Sampler as an example, if the properties in SamplerDescriptor are identical, the cache will be hit, and the comparison logic is in samplerDescriptorEquals.
import { samplerDescriptorEquals } from '@antv/g-device-api';

export class RenderCache {
    device: Device;
    private samplerCache = new HashMap<SamplerDescriptor, Sampler>(
        samplerDescriptorEquals,
        nullHashFunc,
    );

    createSampler(descriptor: SamplerDescriptor): Sampler {
        // 优先从缓存中取
        let sampler = this.samplerCache.get(descriptor);
        if (sampler === null) {
            // 未命中,创建并添加缓存
            sampler = this.device.createSampler(descriptor);
            this.samplerCache.add(descriptor, sampler);
        }
        return sampler;
    }
}
Object fit (object-fit)
A rectangle’s geometry often does not match the image’s intrinsic aspect ratio. Drawing with drawImage(0, 0, width, height) everywhere stretches icons and photos. Design tools usually offer fit / fill / crop modes; we follow CSS [object-fit] and [object-position] on FillLayers entries with type: 'image':
fills: [
    {
        type: 'image',
        value: '/canvas.png',
        objectFit: 'contain',
        objectPosition: 'top left',
    },
];
objectFit | Behavior |
|---|---|
fill | Stretch to fill the geometry (default, same as early raster behavior) |
contain | Scale uniformly; show the whole image; letterboxing may appear |
cover | Scale uniformly; fill the geometry; crop overflow |
none / scale-down | Same semantics as CSS |
See Object fit example for how this maps to Figma image scaling and Pencil mode (stretch / fill / fit).
On the CPU we rasterize the image into a texture: compute the draw rectangle from objectFit and paint into a canvas. For contain / cover, texture size is geometry × device pixel ratio, not max(source width, geometry width)—otherwise the full image fills the bitmap and, when mapped to the shape, still looks like stretched fill.
iOS Live Photo
At the file level, an iOS Live Photo is usually a HEIC still image plus a companion MOV. Neither the browser's native <img> path nor @loaders.gl/images can decode HEIC directly.
We aim to treat it like a normal image: decode a single still frame into a bitmap, then upload it to a texture. Playing the Live Photo's embedded video in the canvas would be a follow-up, with a dedicated component (e.g. tap to play) built separately.
import heic2any from 'heic2any';

async function decodeHeicBlob(blob: Blob): Promise<ImageBitmap> {
    const run = (toType: 'image/png' | 'image/jpeg', quality?: number) =>
        heic2any({
            blob,
            toType,
            quality: toType === 'image/jpeg' ? quality ?? 0.92 : 1,
        });

    const converted = await run('image/png');
    return createImageBitmap(converted);
}
Enhanced SVG: Stroke alignment
Finally, let's introduce an interesting topic. We can implement features that are not currently supported by the SVG specification.
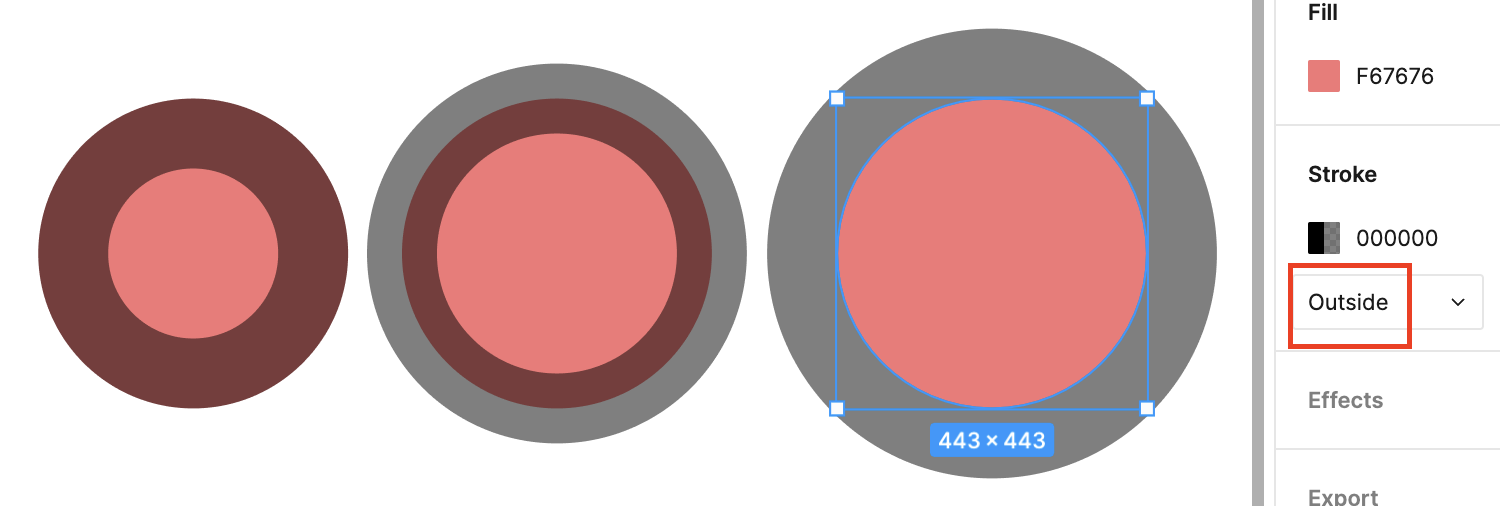
Let's start with the difference between opacity stroke-opacity and fill-opacity in SVG. The circle on the left has opacity=“0.5” and the circle on the right has fill-opacity=“0.5” stroke-opacity=“0.5”. You can see that the stroke stroke is half inside the circle and half outside:
The corresponding Stroke position in Figma is Center, and other options include Inside and Outside, each of which is shown below. In SVG, this is called stroke-alignment, but it is currently in draft form, see Specifying stroke alignment. Pixi.js also provide [PIXI.LineStyle alignment] in WebGL mode.
We add the strokeAlignment property to all shapes:
export interface IRenderable {
    strokeAlignment: 'center' | 'inner' | 'outer';
}
Stroke alignment in Shader
The implementation in the Shader section only needs to distinguish between these three values and mix the fill and stroke colors in different ways:
if (strokeAlignment < 0.5) { // center
    d1 = distance + strokeWidth;
    d2 = distance + strokeWidth / 2.0;
    color = mix_border_inside(over(fillColor, strokeColor), fillColor, d1);
    color = mix_border_inside(strokeColor, color, d2);
} else if (strokeAlignment < 1.5) { // inner
    d1 = distance + strokeWidth;
    d2 = distance;
    color = mix_border_inside(over(fillColor, strokeColor), fillColor, d1);
    color = mix_border_inside(strokeColor, color, d2);
} else if (strokeAlignment < 2.5) { // outer
    d2 = distance + strokeWidth;
    color = mix_border_inside(strokeColor, color, d2); // No need to use fillColor at all
}
Here is our implementation, you can see that the rendering is consistent with Figma:
$icCanvas2 = call(() => {
    return document.createElement('ic-canvas-lesson10');
});call(() => {
const { Canvas, Circle } = Lesson10;
const stats = new Stats();
stats.showPanel(0);
const $stats = stats.dom;
$stats.style.position = 'absolute';
$stats.style.left = '0px';
$stats.style.top = '0px';
$icCanvas2.parentElement.style.position = 'relative';
$icCanvas2.parentElement.appendChild($stats);
$icCanvas2.addEventListener('ic-ready', (e) => {
const canvas = e.detail;
const circle1 = new Circle({
cx: 200,
cy: 200,
r: 50,
fill: '#F67676',
stroke: 'black',
strokeWidth: 20,
strokeOpacity: 0.5,
strokeAlignment: 'inner',
});
canvas.appendChild(circle1);
const circle2 = new Circle({
cx: 320,
cy: 200,
r: 50,
fill: '#F67676',
stroke: 'black',
strokeWidth: 20,
strokeOpacity: 0.5,
});
canvas.appendChild(circle2);
const circle3 = new Circle({
cx: 460,
cy: 200,
r: 50,
fill: '#F67676',
stroke: 'black',
strokeWidth: 20,
strokeOpacity: 0.5,
strokeAlignment: 'outer',
});
canvas.appendChild(circle3);
});
$icCanvas2.addEventListener('ic-frame', (e) => {
stats.update();
});
});This property also needs to be taken into account when calculating the rendering bounding box and pickup determination. The function below reflects how far out from the graphic itself the stroke should extend for different values.
function strokeOffset(
    strokeAlignment: 'center' | 'inner' | 'outer',
    strokeWidth: number,
) {
    if (strokeAlignment === 'center') {
        return strokeWidth / 2;
    } else if (strokeAlignment === 'inner') {
        return 0;
    } else if (strokeAlignment === 'outer') {
        return strokeWidth;
    }
}
Export SVG
As mentioned earlier, SVG does not currently support stroke-alignment, so it can only be simulated by hacking at the moment. If the drawing is simple, it is possible to draw the fill and stroke in two passes. Here is Figma's export of stroke-alignment: 'inner', which also uses this approach:
<circle cx="200" cy="200" r="200" fill="#F67676" />
<circle
    cx="200"
    cy="200"
    r="160"
    stroke="black"
    stroke-opacity="0.5"
    stroke-width="100"
/>
In addition to this, the Figma documentation in StrokeAlign in Figma widget gives another idea, which does not require creating two similar elements. How to simulate stroke-align (stroke-alignment) in SVG tries this idea by enlarging the stroke width to twice its original width and eliminating the excess with clipPath and mask:
Inside and outside stroke are actually implemented by doubling the stroke weight and masking the stroke by the fill. This means inside-aligned stroke will never draw strokes outside the fill and outside-aligned stroke will never draw strokes inside the fill.
For simplicity of implementation, we choose the first approach, creating two similar elements to draw the fill and stroke respectively, which can be tried to export SVG in the above example.
With the richness of the canvas functionality, it is necessary to introduce tests to verify that the import/export functionality works properly, that the rendering is correct, and that the UI components are interactive. We will introduce it in the next section.